https://dinfuehr.github.io/blog/a-first-look-into-zgc/
https://www.opsian.com/blog/javas-new-zgc-is-very-exciting/
The mechanisms by which it can achieve this can also be extended in the future to support some exciting possibilities such as multi-tiered heaps i.e DRAM for hot objects and NVMe flash for less frequently accessed ones, or compressed heaps.
Stop The World - in a stop the world phase, the application threads are suspended in order for the gc to carry out its work. When you experience GC pauses this is due to a Stop The World phase.
Incremental - if a phase is incremental then it can run for a period and terminate early due to some condition, e.g time budget or a higher priority gc phase that needs carrying out, while still having done productive work. This is in contrast to a phase that needs to fully complete for it to have been productive.
To achieve its goals ZGC uses two techniques new to Hotspot Garbage Collectors: coloured pointers and load barriers.
Pointer colouring
Pointer colouring is a technique that stores information in pointers (or in Java parlance, references) themselves. This is possible because on 64-bit platforms (ZGC is 64-bit only) a pointer can address vastly more memory than a system can realistically have and so it’s possible to use some of the other bits to store state. ZGC restricts itself to 4Tb heaps which require 42-bits, leaving 22-bits of possible state of which it currently uses 4-bits: finalizable, remap, mark0 and mark1.
Multi-mapping involves mapping different ranges of virtual memory to the same physical memory. Since by design only one of remap, mark0 and mark1 can be 1 at any point in time, it’s possible to do this with three mappings.
Load barriers are pieces of code that run whenever an application thread loads a reference from the heap (i.e accesses a non-primitive field on an object):
void printName( Person person ) {
String name = person.name; // would trigger the load barrier
// because we’ve loaded a reference
// from the heap
System.out.println(name); // no load barrier directly
}
In the above code, the line that assigns name involves following the person reference to the object data on the heap and then loading the reference to name it contains. It is at this point the load barrier is triggered. The second line, that triggers a print to the screen, won’t directly cause the load barrier to trigger because there is no load of a reference from the heap - name is a local variable and so no reference is being loaded from the heap. There may be other load barriers triggered on referencing System and out, or inside println however.
ZGC’s Marking is broken up into three phases. The first phase is a Stop The World one where the GC roots are marked as being live. GC roots are things like local variables, which the application can use to access the rest of the objects on the heap. If an object isn’t reachable by a walk of the object graph starting from the roots then there’s no way an application could access it and it is considered garbage. The set of objects accessible from the roots is referred to as the live set. The GC roots marking step is very short, as the total number of roots is often relatively small.
Once that phase has completed, the application resumes and ZGC begins the next phase which concurrently walks the object graph and marks all accessible objects. During this phase the load barrier is testing all loaded references against a mask that determines if they have been marked or not yet for this phase, if a reference hasn’t been marked then it is added to a queue for marking.
After the walk is complete, there’s a final, brief, Stop The World phase which handles some edge cases (which we’re going to ignore for now) and then marking is complete.
The next major part of the GC cycle is that of relocation. Relocation involves moving live objects around in order to free up sections of the heap. Why move objects rather than just fill in the gaps? Some GCs do in fact do that but it has the unfortunate consequence that allocation becomes much more expensive as when an allocation is required the allocator needs to find a free space to place the object. In contrast, if large chunks of memory can be freed up then allocation becomes simply incrementing (or ‘bumping’) the pointer by the amount of memory required for the object.
ZGC divides the heap up in to pages and at the start of this phase it concurrently selects a set of pages whose live objects need to be relocated. When the relocation set is selected, there is a Stop The World pause where ZGC relocates any objects in the relocation set that are referenced as a root (local variables, etc.) and remaps their reference to the new location. As with the earlier Stop The World step, the pause time involved here depends only on the number of roots and the ratio of the sizes of the relocation set and total live set of objects, which is normally reasonably small. It doesn’t scale with the overall size of the heap, like many collectors do.
After moving any roots that were necessary, the next phase is concurrent relocation. During this phase GC threads walk the relocation set and relocate all the objects in the pages it contains. Application threads can also relocate objects in the relocation set if they try to load them before the GC has relocated them, this is achieved through the load barrier (which is triggered on loading references from the heap) as detailed on the following flowchart:
nearly all the pauses we’ve covered involve work that depends on the set of GC roots rather than the live set of objects, heap size or garbage. The final pause in the Marking phase, which deals with mark termination, is an exception to this but is incremental and the GC reverts to concurrent marking if it’s time budget is exceeded until it is attempted again.
https://www.infoq.com/articles/G1-One-Garbage-Collector-To-Rule-Them-All
https://www.dynatrace.com/news/blog/understanding-g1-garbage-collector-java-9/
Most state-of-the-art GCs classify heaps into either young generation or old generation objects. This is done mostly because studies of real-world Java applications have shown that more than 90% of objects don’t survive their first garbage collection. Older objects (objects that have survived a few collection cycles) however tend to remain alive and have a 98% chance of surviving. Java GCs split the young generation objects further into the survivor space and the Eden space. Newly allocated objects are always allocated to the Eden space. Once an object survives its first garbage collection, it’s moved to the survivor space. When an object survives multiple collection cycles, it’s eventually moved to the older generation. This is done so that a run-time efficient algorithm can be used on new objects (this algorithm’s run-time depends only on the number of surviving objects but wastes half the heap size) and a memory-efficient algorithm can be used on the old generation (this algorithm’s run-time depends on the heap size, but it uses available memory as efficiently as possible).
(
https://mp.weixin.qq.com/s/KUCs_BJUNfMMCO1T3_WAjw
G1 通过每次只回收部分Region而不是全堆,改善了大堆下的停顿时间,但在普通大小的堆里表现并没惊喜
这里的并发(Concurrent),说的是应用线程与GC线程齐头并进,互不添堵。
https://stackoverflow.com/questions/14370738/java-heap-overwhelmed-by-unreachable-objects
As Paul Bellora suggested, this was caused by too large amount of objects created within the JVM, in too short period of a time.
https://stackoverflow.com/questions/19154607/how-actually-card-table-and-writer-barrier-works
https://blogs.msdn.microsoft.com/abhinaba/2009/03/02/back-to-basics-generational-garbage-collection/
Card Table in Java HotSpot VM (1)
•Eliminating the need to scan the entire old generation
▫Old generation is split into 512-byte chunks called cards
▫The card table is an array with one byte entry per card in the heap
▫Mark the container card dirty when a field is updated
▫Scan only dirty cards in minor collection
•A Write barrier to maintain the card table
▫Executed every time a reference field is updated
▫Do impact performance on the execution a bit
▫Allows for much faster minor collections
•Many barriers perform checks but no real work
▫old-to-young references are rare
•Many barriers are self-healing
▫No need to further check a logged old-to-young reference
•Accelerate barriers by keeping track
•Extend the instruction set with an operation dftl
▫Test if the barrier’s input are already in the set
https://www.infoq.com/articles/Java_Garbage_Collection_Distilled
GC log analyze tool:
http://gceasy.io/
https://blog.gceasy.io/2016/06/18/garbage-collection-log-analysis-api/
http://blog.ragozin.info/2012/10/safepoints-in-hotspot-jvm.html
https://blog.gceasy.io/2016/11/15/rotating-gc-log-files/
https://dzone.com/articles/java-runtime-performance-monitoring-gc-and-safepoi
http://mattwarren.org/2016/08/08/GC-Pauses-and-Safe-Points/
https://www.azul.com/products/zing/pgc/
https://www.jclarity.com/2016/02/02/how-to-create-useful-gc-and-safepoint-logs/
G1 GC is an incremental parallel compacting GC that provides more predictable pause times compared to CMS GC and Parallel Old GC. By introducing a parallel, concurrent and multi-phased marking cycle, G1 GC can work with much larger heaps while providing reasonable worst-case pause times. The basic idea with G1 GC is to set your heap ranges (using -Xms for min heap size and -Xmx for the max size) and a realistic (soft real time) pause time goal (using -XX:MaxGCPauseMillis) and then let the GC do its job.
With the introduction of G1 GC, HotSpot moves away from its conventional GC layout where a contiguous Java heap splits into (contiguous) young and old generations. In G1 GC, HotSpot introduces the concept of “regions”. A single large contiguous Java heap space divides into multiple fixed-sized heap regions. A list of “free” regions maintains these regions. As the need arises, the free regions are assigned to either the young or the old generation. These regions can span from 1MB to 32MB in size depending on your total Java heap size. The goal is to have around 2048 regions for the total heap. Once a region frees up, it goes back to the "free" regions list. The principle of G1 GC is to reclaim the Java heap as much as possible (while trying its best to meet the pause time goal) by collecting the regions with the least amount of live data i.e. the ones with most garbage, first; hence the name Garbage First.


http://www.oracle.com/technetwork/tutorials/tutorials-1876574.html
G1 is planned as the long term replacement for the Concurrent Mark-Sweep Collector (CMS). Comparing G1 with CMS, there are differences that make G1 a better solution. One difference is that G1 is a compacting collector. G1 compacts sufficiently to completely avoid the use of fine-grained free lists for allocation, and instead relies on regions. This considerably simplifies parts of the collector, and mostly eliminates potential fragmentation issues. Also, G1 offers more predictable garbage collection pauses than the CMS collector, and allows users to specify desired pause targets.

The heap is partitioned into a set of equal-sized heap regions, each a contiguous range of virtual memory. Certain region sets are assigned the same roles (eden, survivor, old) as in the older collectors, but there is not a fixed size for them. This provides greater flexibility in memory usage.
When performing garbage collections, G1 operates in a manner similar to the CMS collector. G1 performs a concurrent global marking phase to determine the liveness of objects throughout the heap. After the mark phase completes, G1 knows which regions are mostly empty. It collects in these regions first, which usually yields a large amount of free space. This is why this method of garbage collection is called Garbage-First. As the name suggests, G1 concentrates its collection and compaction activity on the areas of the heap that are likely to be full of reclaimable objects, that is, garbage. G1 uses a pause prediction model to meet a user-defined pause time target and selects the number of regions to collect based on the specified pause time target.
The regions identified by G1 as ripe for reclamation are garbage collected using evacuation. G1 copies objects from one or more regions of the heap to a single region on the heap, and in the process both compacts and frees up memory. This evacuation is performed in parallel on multi-processors, to decrease pause times and increase throughput. Thus, with each garbage collection, G1 continuously works to reduce fragmentation, working within the user defined pause times. This is beyond the capability of both the previous methods. CMS (Concurrent Mark Sweep ) garbage collector does not do compaction. ParallelOld garbage collection performs only whole-heap compaction, which results in considerable pause times.
http://www.kawabangga.com/posts/1336
http://www.cs.virginia.edu/~cs415/reading/bacon-garbage.pdf
标记清除
标记清除的方式需要对程序的对象进行两次扫描,第一次从根(Root)开始扫描,被根引用了的对象标记为不是垃圾,不是垃圾的对象引用的对象同样标记为不是垃圾,以此递归。所有不是垃圾的对象的引用都扫描完了之后。就进行第二次扫描,第一次扫描中没有得到标记的对象就是垃圾了,对此进行回收。
复制收集
复制收集的方式只需要对对象进行一次扫描。准备一个「新的空间」,从根开始,对对象进行扫,如果存在对这个对象的引用,就把它复制到「新空间中」。一次扫描结束之后,所有存在于「新空间」的对象就是所有的非垃圾对象。
这两种方式各有千秋,标记清除的方式节省内存但是两次扫描需要更多的时间,对于垃圾比例较小的情况占优势。复制收集更快速但是需要额外开辟一块用来复制的内存,对垃圾比例较大的情况占优势。特别的,复制收集有「局部性」的优点。
在复制收集的过程中,会按照对象被引用的顺序将对象复制到新空间中。于是,关系较近的对象被放在距离较近的内存空间的可能性会提高,这叫做局部性。局部性高的情况下,内存缓存会更有效地运作,程序的性能会提高。
对于标记清除,有一种标记-压缩算法的衍生算法:
对于压缩阶段,它的工作就是移动所有的可达对象到堆内存的同一个区域中,使他们紧凑的排列在一起,从而将所有非可达对象释放出来的空闲内存都集中在一起,通过这样的方式来达到减少内存碎片的目的。
它们的衍生算法
分代回收
增量回收
并行回收
引用计数
引用计数是指,针对每一个对象,保存一个对该对象的引用计数,该对象的引用增加,则相应的引用计数增加。如果对象的引用计数为零,则回收该对象。
缺点:最著名的缺点就是如果对象中存在循环引用,就无法被回收。例如,下面三个对象互相引用,但是不存在从根(Root)指向的引用,所以已经是垃圾了。但是引用计数不为0.
http://www.infoq.com/articles/Java-PERMGEN-Removed
The collection of the permanent generation would be tied to the collection of the old generation, so whenever either gets full, both the permanent generation and the old generation would be collected.
Trivia: Before JDK7, for HotSpot JVM, interned-strings were also held in the permanent generation aka PermGen, causing a vast number of performance issues and OOM errors.
The metadata has now moved to native memory to an area known as the “Metaspace”.
http://www.importnew.com/3151.html
STW 和HTTP 503
https://phabricator.wikimedia.org/T148655
https://issues.apache.org/jira/browse/HBASE-12816
https://issues.apache.org/jira/secure/attachment/12690859/HBASE-12816.patch
https://www.opsian.com/blog/javas-new-zgc-is-very-exciting/
The mechanisms by which it can achieve this can also be extended in the future to support some exciting possibilities such as multi-tiered heaps i.e DRAM for hot objects and NVMe flash for less frequently accessed ones, or compressed heaps.
Stop The World - in a stop the world phase, the application threads are suspended in order for the gc to carry out its work. When you experience GC pauses this is due to a Stop The World phase.
Incremental - if a phase is incremental then it can run for a period and terminate early due to some condition, e.g time budget or a higher priority gc phase that needs carrying out, while still having done productive work. This is in contrast to a phase that needs to fully complete for it to have been productive.
To achieve its goals ZGC uses two techniques new to Hotspot Garbage Collectors: coloured pointers and load barriers.
Pointer colouring
Pointer colouring is a technique that stores information in pointers (or in Java parlance, references) themselves. This is possible because on 64-bit platforms (ZGC is 64-bit only) a pointer can address vastly more memory than a system can realistically have and so it’s possible to use some of the other bits to store state. ZGC restricts itself to 4Tb heaps which require 42-bits, leaving 22-bits of possible state of which it currently uses 4-bits: finalizable, remap, mark0 and mark1.
Multi-mapping involves mapping different ranges of virtual memory to the same physical memory. Since by design only one of remap, mark0 and mark1 can be 1 at any point in time, it’s possible to do this with three mappings.
Load barriers are pieces of code that run whenever an application thread loads a reference from the heap (i.e accesses a non-primitive field on an object):
void printName( Person person ) {
String name = person.name; // would trigger the load barrier
// because we’ve loaded a reference
// from the heap
System.out.println(name); // no load barrier directly
}
In the above code, the line that assigns name involves following the person reference to the object data on the heap and then loading the reference to name it contains. It is at this point the load barrier is triggered. The second line, that triggers a print to the screen, won’t directly cause the load barrier to trigger because there is no load of a reference from the heap - name is a local variable and so no reference is being loaded from the heap. There may be other load barriers triggered on referencing System and out, or inside println however.
ZGC’s Marking is broken up into three phases. The first phase is a Stop The World one where the GC roots are marked as being live. GC roots are things like local variables, which the application can use to access the rest of the objects on the heap. If an object isn’t reachable by a walk of the object graph starting from the roots then there’s no way an application could access it and it is considered garbage. The set of objects accessible from the roots is referred to as the live set. The GC roots marking step is very short, as the total number of roots is often relatively small.
Once that phase has completed, the application resumes and ZGC begins the next phase which concurrently walks the object graph and marks all accessible objects. During this phase the load barrier is testing all loaded references against a mask that determines if they have been marked or not yet for this phase, if a reference hasn’t been marked then it is added to a queue for marking.
After the walk is complete, there’s a final, brief, Stop The World phase which handles some edge cases (which we’re going to ignore for now) and then marking is complete.
The next major part of the GC cycle is that of relocation. Relocation involves moving live objects around in order to free up sections of the heap. Why move objects rather than just fill in the gaps? Some GCs do in fact do that but it has the unfortunate consequence that allocation becomes much more expensive as when an allocation is required the allocator needs to find a free space to place the object. In contrast, if large chunks of memory can be freed up then allocation becomes simply incrementing (or ‘bumping’) the pointer by the amount of memory required for the object.
ZGC divides the heap up in to pages and at the start of this phase it concurrently selects a set of pages whose live objects need to be relocated. When the relocation set is selected, there is a Stop The World pause where ZGC relocates any objects in the relocation set that are referenced as a root (local variables, etc.) and remaps their reference to the new location. As with the earlier Stop The World step, the pause time involved here depends only on the number of roots and the ratio of the sizes of the relocation set and total live set of objects, which is normally reasonably small. It doesn’t scale with the overall size of the heap, like many collectors do.
After moving any roots that were necessary, the next phase is concurrent relocation. During this phase GC threads walk the relocation set and relocate all the objects in the pages it contains. Application threads can also relocate objects in the relocation set if they try to load them before the GC has relocated them, this is achieved through the load barrier (which is triggered on loading references from the heap) as detailed on the following flowchart:
nearly all the pauses we’ve covered involve work that depends on the set of GC roots rather than the live set of objects, heap size or garbage. The final pause in the Marking phase, which deals with mark termination, is an exception to this but is incremental and the GC reverts to concurrent marking if it’s time budget is exceeded until it is attempted again.
https://www.infoq.com/articles/G1-One-Garbage-Collector-To-Rule-Them-All
Let us now expand on the above paragraph: Suppose an allocation failure in the young generation triggers a young collection, leading to promotions to the old generation. Further, suppose that the fragmented old generation has insufficient space for the newly promoted objects. Such conditions would trigger a full garbage collection cycle, which will perform compaction of the heap.
With CMS GC, the full collection is serial and STW, hence your application threads are stopped for the entire duration while the heap space is reclaimed and then compacted. The duration for the STW pause depends on your heap size and the surviving objects.
Alternatively, even if you do have parallel (multi-threaded) compaction to combat fragmentation, you still end up with a full garbage collection (that involves all the generations of the Java heap), when it might have been sufficient to just reclaim some of the free space from the old generation.
This is a common scenario with Parallel Old GC. With Parallel Old, the reclamation of old generation is with a parallel STW full garbage collection pause. This full garbage collection is not incremental; it is one big STW pause and does not interleave with the application execution.
G1 GC is an incremental parallel compacting GC that provides more predictable pause times compared to CMS GC and Parallel Old GC. By introducing a parallel, concurrent and multi-phased marking cycle, G1 GC can work with much larger heaps while providing reasonable worst-case pause times. The basic idea with G1 GC is to set your heap ranges (using -Xms for min heap size and -Xmx for the max size) and a realistic (soft real time) pause time goal (using -XX:MaxGCPauseMillis) and then let the GC do its job.
In G1 GC, HotSpot introduces the concept of “regions”. A single large contiguous Java heap space divides into multiple fixed-sized heap regions. A list of “free” regions maintains these regions. As the need arises, the free regions are assigned to either the young or the old generation. These regions can span from 1MB to 32MB in size depending on your total Java heap size. The goal is to have around 2048 regions for the total heap. Once a region frees up, it goes back to the "free" regions list. The principle of G1 GC is to reclaim the Java heap as much as possible (while trying its best to meet the pause time goal) by collecting the regions with the least amount of live data i.e. the ones with most garbage, first; hence the name Garbage First.
One thing to note is that for G1 GC, neither the young nor the old generation has to be contiguous. This is a handy feature since the sizing of the generation is now more dynamic.
Adaptive sized GC algorithms like the Parallel Old GC, end up reserving the extra space that may be required by each generation so that they can fit in their contiguous space constraint. In case of CMS, a full garbage collection is required to resize the Java heap and the generations.
In contrast, G1 GC uses logical generations (a collection of non-contiguous regions of the young generation and a remainder in the old generation), so there is not much wastage in space or time.
To be sure, the G1 GC algorithm does utilize some of HotSpot’s basic concepts. For example, the concepts of allocation, copying to survivor space and promotion to old generation are similar to previous HotSpot GC implementations. Eden regions and survivor regions still make up the young generation. Most allocations happen in eden except for “humongous” allocations. (Note: For G1 GC, objects that span more than half a region size are considered “Humongous objects” and are directly allocated into “humongous” regions out of the old generation.) G1 GC selects an adaptive young generation size based on your pause time goal. The young generation can range anywhere from the preset min to the preset max sizes, that are a function of the Java heap size. When eden reaches capacity, a “young garbage collection”, also known as an “evacuation pause”, will occur. This is a STW pause that copies (evacuates) the live objects from the regions that make up the eden, to the 'to-space' survivor regions.
In addition, live objects from the 'from-space' survivor regions will be either copied to the 'to-space' survivor regions or, based on the object's age and the 'tenuring threshold', will be promoted to region(s) from the old generation space.
Most state-of-the-art GCs classify heaps into either young generation or old generation objects. This is done mostly because studies of real-world Java applications have shown that more than 90% of objects don’t survive their first garbage collection. Older objects (objects that have survived a few collection cycles) however tend to remain alive and have a 98% chance of surviving. Java GCs split the young generation objects further into the survivor space and the Eden space. Newly allocated objects are always allocated to the Eden space. Once an object survives its first garbage collection, it’s moved to the survivor space. When an object survives multiple collection cycles, it’s eventually moved to the older generation. This is done so that a run-time efficient algorithm can be used on new objects (this algorithm’s run-time depends only on the number of surviving objects but wastes half the heap size) and a memory-efficient algorithm can be used on the old generation (this algorithm’s run-time depends on the heap size, but it uses available memory as efficiently as possible).
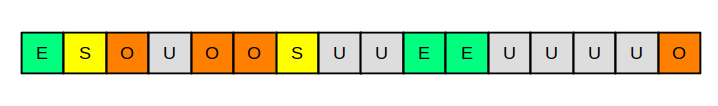
Compared to most other garbage collectors, the G1 has two big advantages: (1) it can do most of its work concurrently (i.e., without halting application threads), and (2) it uses non-continuous spaces, which enables the G1 to efficiently deal with very large heaps. Also, the G1 can collect both the young and the old generation at once. This has something to do with the unique way the G1 uses the available heap. Instead of splitting the heap into three spaces (Eden, survivor, and old) like most other GCs, it splits the heap into many (often several hundred) very small regions. These regions are fix-sized (about 2Mb by default). Each region is assigned to a space. A G1 heap could look like this:
(
O: old, S: survivor, E: Eden, U: unassigned)
Splitting the heap into small regions enables the G1 to select a small group of regions to collect and finish quickly. If a region is scheduled for collection, all surviving objects will be copied from the collected region to an unassigned region. Assuming that the collected region was of the Eden space, the unassigned region holding all surviving objects will then become a survivor region. Ideally, if a region is full of garbage (meaning it doesn’t contain a single surviving object), the region can be declared “unassigned” and no work has to be done there.
The downside is that the G1 doesn’t perform well with small heaps. Where the sweet spot lies depends on the application in question. If needed, you can always fall back to the old default collector by setting the
-XX:+UseParallelOldGC flag. If the G1 has too little heap available, you will see “Full GC”s in the GC log. A Full GC is only performed when the G1 determines that the usual mode of operation as described above is no longer possible. In this case, the entire heap is collected with a memory-efficient (but slow) algorithm that ideally will make things better for the next collection. If there are “Full GC”s occurring, you should increase the heap size if possible and fall back to another GC if necessary.
Due to the small regions, the G1 can be configured to limit its maximum pause time by setting
-XX:MaxGCPauseMillis=n. The G1 will then estimate the maximum number of regions it can collect at once without overstepping this limit based on previous collections as well as on the amount of detected garbage. The G1 is still far from being a real-time collector, however, it performs better than other collectors that can’t even begin to adhere to such a limit because of their rigid heap structures.与标记对象的传统算法相比,ZGC在指针上做标记,在访问指针时加入Load Barrier(读屏障),比如当对象正被GC移动,指针上的颜色就会不对,这个屏障就会先把指针更新为有效地址再返回,也就是,永远只有单个对象读取时有概率被减速,而不存在为了保持应用与GC一致而粗暴整体的Stop The World。
说几乎,就是还有三个非常短暂的STW的阶段,所以ZGC并不是Zero Pause GC啦。
R大:“比如开始的Pause Mark Start阶段,要做根集合(root set)扫描,包括全局变量啊、线程栈啊啥的里面的对象指针,但不包括GC堆里的对象指针,所以这个暂停就不会随着GC堆的大小而变化(不过会根据线程的多少啊、线程栈的大小之类的而变化)” -- 因此ZGC可以拍胸脯,无论堆多大停顿都小于10ms。
原理前面R大一句话已经说完了。Colored Pointer 从64位的指针中,借了几位出来表示Finalizable、Remapped、Marked1、Marked0。 所以它不支持32位指针也不支持压缩指针, 且堆的上限是4TB。
https://stackoverflow.com/questions/14370738/java-heap-overwhelmed-by-unreachable-objects
As Paul Bellora suggested, this was caused by too large amount of objects created within the JVM, in too short period of a time.
https://stackoverflow.com/questions/19154607/how-actually-card-table-and-writer-barrier-works
https://blogs.msdn.microsoft.com/abhinaba/2009/03/02/back-to-basics-generational-garbage-collection/
Whenever an reference assignment is made in user code, instead of directly doing the assignment it is redirected to a small thunk (incase .NET the JITter does this). The thunk compares the assignees address to that of the Gen1 memory range. If the range falls within, then the thunk updates the corresponding bit in the card table to indicate that the range which the bit covers is now dirty (shown as red).
https://www.slideshare.net/zellux/dynamic-filtering-multipurpose-architecture-support-for-language-runtime-systemsCard Table in Java HotSpot VM (1)
•Eliminating the need to scan the entire old generation
▫Old generation is split into 512-byte chunks called cards
▫The card table is an array with one byte entry per card in the heap
▫Mark the container card dirty when a field is updated
▫Scan only dirty cards in minor collection
•A Write barrier to maintain the card table
▫Executed every time a reference field is updated
▫Do impact performance on the execution a bit
▫Allows for much faster minor collections
•Many barriers perform checks but no real work
▫old-to-young references are rare
•Many barriers are self-healing
▫No need to further check a logged old-to-young reference
•Accelerate barriers by keeping track
•Extend the instruction set with an operation dftl
▫Test if the barrier’s input are already in the set
https://www.infoq.com/articles/Java_Garbage_Collection_Distilled
A minor collection is triggered when Eden becomes full. This is done by copying all the live objects in the new generation to either a survivor space or the tenured space as appropriate. Copying to the tenured space is known as promotion or tenuring. Promotion occurs for objects that are sufficiently old (– XX:MaxTenuringThreshold), or when the survivor space overflows.
A minor collection is triggered when Eden becomes full. This is done by copying all the live objects in the new generation to either a survivor space or the tenured space as appropriate. Copying to the tenured space is known as promotion or tenuring. Promotion occurs for objects that are sufficiently old (– XX:MaxTenuringThreshold), or when the survivor space overflows.
Live objects are objects that are reachable by the application; any other objects cannot be reached and can therefore be considered dead. In a minor collection, the copying of live objects is performed by first following what are known as GC Roots, and iteratively copying anything reachable to the survivor space. GC Roots normally include references from application and JVM-internal static fields, and from thread stack-frames, all of which effectively point to the application’s reachable object graphs.
In generational collection, the GC Roots for the new generation’s reachable object graph also include any references from the old generation to the new generation. These references must also be processed to make sure all reachable objects in the new generation survive the minorcollection. Identifying these cross-generational references is achieved by use of a “card table”. The Hotspot card table is an array of bytes in which each byte is used to track the potential existence of cross-generational references in a corresponding 512 byte region of the oldgeneration. As references are stored to the heap, “store barrier” code will mark cards to indicate that a potential reference from the old generation to the new generation may exist in the associated 512 byte heap region. At collection time, the card table is used to scan for such cross-generational references, which effectively represent additional GC Roots into the new generation. Therefore a significant fixed cost of minor collections is directly proportional to the size of the oldgeneration.
The cost of a minor GC collection is usually dominated by the cost of copying objects to the survivor and tenured spaces. Objects that do not survive a minor collection are effectively free to be dealt with. The work done during a minor collection is directly proportional to the number of live objects found, and not to the size of the new generation. The total time spent doing minorcollections can be almost be halved each time the Eden size is doubled. Memory can therefore be traded for throughput. A doubling of Eden size will result in an increase in collection time per-collection cycle, but this is relatively small if both the number of objects being promoted and size of the old generation is constant.
Note: In Hotspot minor collections are stop-the-world events. This is rapidly becoming a major issue as our heaps get larger with more live objects. We are already starting to see the need for concurrent collection of the young generation to reach pause-time targets.
Major Collections
Major collections collect the old generation so that objects can be promoted from the younggeneration. In most applications, the vast majority of program state ends up in the old generation.
The old generation collector will try to predict when it needs to collect to avoid a promotion failure from the young generation. The collectors track a fill threshold for the old generation and begin collection when this threshold is passed. If this threshold is not sufficient to meet promotion requirements then a “FullGC” is triggered. A FullGC involves promoting all live objects from the young generations followed by a collection and compaction of the old generation. Promotion failure is a very expensive operation as state and promoted objects from this cycle must be unwound so the FullGC event can occur.
Note: To avoid promotion failure you will need to tune the padding that the old generation allows to accommodate promotions (‑XX:PromotedPadding=<n>).
Note: When the Heap needs to grow a FullGC is triggered. These heap-resizing FullGCs can be avoided by setting –Xms and –Xmx to the same value.
Other than a FullGC, a compaction of the old generation is likely to be the largest stop-the-world pause an application will experience. The time for this compaction tends to grow linearly with the number of live objects in the tenured space.
http://gceasy.io/
https://blog.gceasy.io/2016/06/18/garbage-collection-log-analysis-api/
curl -X POST --data-binary @./my-app-gc.log http://api.gceasy.io/analyzeGC?apiKey={API_KEY_SENT_IN_EMAIL} --header "Content-Type:text"
Note: use the option “–data-binary” in the CURL instead of using “–data” option. In “–data” new line breaks will be not preserved in the request. New Line breaks should be preserved for legitimate parsing.
Safepoints
In HotSpot JVM Stop-the-World pause mechanism is called safepoint. During safepoint all threads running java code are suspended. Threads running native code may continue to run as long as they do not interact with JVM (attempt to access Java objects via JNI, call Java method or return from native to java, will suspend thread until end of safepoint).
Stopping all threads are required to ensure what safepoint initiator have exclusive access to JVM data structures and can do crazy things like moving objects in heap or replacing code of method which is currently running (On-Stack-Replacement).
Safepoint protocol in HotSpot JVM is collaborative. Each application thread checks safepoint status and park itself in safe state in safepoint is required.
For compiled code, JIT inserts safepoint checks in code at certain points (usually, after return from calls or at back jump of loop). For interpreted code, JVM have two byte code dispatch tables and if safepoint is required, JVM switches tables to enable safepoint check.
- -XX:+PrintGCApplicationStoppedTime – this will actually report pause time for all safepoints (GC related or not). Unfortunately output from this option lacks timestamps, but it is still useful to narrow down problem to safepoints.
- -XX:+PrintSafepointStatistics –XX:PrintSafepointStatisticsCount=1 – this two options will force JVM to report reason and timings after each safepoint (it will be reported to stdout, not GC log).
a. -XX:+DisableExplicitGC
You can forcefully disable the System.gc() calls by passing the JVM argument: ‘-XX:+DisableExplicitGC‘. But before using this option, try to understand the reason why first in place this call was made by your application developer or 3rd party framework. Maybe if it’s not for a valid reason, then pass the ‘-XX:+DisableExplicitGC‘ JVM argument.
b. RMI
If your application is using RMI, then you can control the frequency in which System.gc() calls are made. This frequency can be configured using the following system properties:
-Dsun.rmi.dgc.server.gcInterval=n
-Dsun.rmi.dgc.client.gcInterval=n
-Dsun.rmi.dgc.client.gcInterval=n
You need to capture thread dumps and GC logs at the moment when problem is happening, in order to diagnose the problem
https://blog.gceasy.io/2016/11/15/rotating-gc-log-files/
"-XX:+PrintGCDetails -XX:+PrintGCDateStamps -Xloggc:/home/GCEASY/gc-$(date +%Y_%m_%d-%H_%M).log"
"-XX:+PrintGCDetails -XX:+PrintGCDateStamps -Xloggc:/home/GCEASY/gc.log -XX:+UseGCLogFileRotation -XX:NumberOfGCLogFiles=5 -XX:GCLogFileSize=2M"
Now to analyze the GC log file using the GC tools such as (gceasy.io, GCViewer….), you will have to upload multiple GC log files instead of just one single GC Log file.
http://mattwarren.org/2016/08/08/GC-Pauses-and-Safe-Points/
https://www.azul.com/products/zing/pgc/
Zing® is the only JVM that uses Azul’s unique C4 (Continuously Concurrent Compacting Collector) to provide pauseless garbage collection operation. C4 is able to concurrently compact the Java heap and to allow the application to continue to execute while remapping of memory is performed. This patented solution allows applications to completely separate heap size from response times for predictable, consistent Java GC behavior. If your Java application has unacceptable pauses, try Zing free, and see how much it can improve application metrics out of the box, with no tuning.
https://www.jclarity.com/2016/02/02/how-to-create-useful-gc-and-safepoint-logs/
These flags ensure that the minimum set of GC data required to perform most types of analysis is printed out to a GC log,which is separate from your application log!
- -XX:+PrintGCDetails
- -XX:+PrintTenuringDistribution
- -Xloggc:<Location to write your GC log to>
For example:
java -XX:+PrintGCDetails -XX:+PrintTenuringDistribution -Xloggc:gc.log -jar myApp.jar
<Optional> The following GC flags are also recommended:
The following flags ensure that you can see the actual wall clock date and time of your GC events (so you can correlate with application logs) and get some more insights as to the cause of GCs and the amount of time it takes the JVM prepare and cleanup after a GC cycle.
- -XX:+PrintGCCause
- -XX:+PrintGCApplicationStoppedTime
- -XX:+PrintGCDateStamps
<Optional> Recommended Safepoint Log flags:
In order to create a Safepoint log and discover other non GC reasons for your JVM pausing, you need to have the following flags set.
WARNING: -XX:+UnlockDiagnosticVMOptions must be the first flag.
WARNING: -XX:+PrintSafepointStatistics does also print to stdout.
WARNING: -XX:+PrintSafepointStatistics does also print to stdout.
- -XX:+UnlockDiagnosticVMOptions
- -XX:+PrintSafepointStatistics
- -XX:+LogVMOutput
- -XX:LogFile=<Location to write your Safepoint log to>
For example:
java -XX:+UnlockDiagnosticVMOptions <other various GC log flags> -XX:+PrintSafepointStatistics -XX:+LogVMOutput -XX:LogFile=safepoint.log -jar myApp.jar
https://docs.oracle.com/javase/8/docs/technotes/tools/unix/java.html- -XX:LogFile=path
- Sets the path and file name where log data is written. By default, the file is created in the current working directory, and it is named
hotspot.log.The following example shows how to set the log file to/var/log/java/hotspot.log:-XX:LogFile=/var/log/java/hotspot.log
G1 GC is an incremental parallel compacting GC that provides more predictable pause times compared to CMS GC and Parallel Old GC. By introducing a parallel, concurrent and multi-phased marking cycle, G1 GC can work with much larger heaps while providing reasonable worst-case pause times. The basic idea with G1 GC is to set your heap ranges (using -Xms for min heap size and -Xmx for the max size) and a realistic (soft real time) pause time goal (using -XX:MaxGCPauseMillis) and then let the GC do its job.
With the introduction of G1 GC, HotSpot moves away from its conventional GC layout where a contiguous Java heap splits into (contiguous) young and old generations. In G1 GC, HotSpot introduces the concept of “regions”. A single large contiguous Java heap space divides into multiple fixed-sized heap regions. A list of “free” regions maintains these regions. As the need arises, the free regions are assigned to either the young or the old generation. These regions can span from 1MB to 32MB in size depending on your total Java heap size. The goal is to have around 2048 regions for the total heap. Once a region frees up, it goes back to the "free" regions list. The principle of G1 GC is to reclaim the Java heap as much as possible (while trying its best to meet the pause time goal) by collecting the regions with the least amount of live data i.e. the ones with most garbage, first; hence the name Garbage First.
Fig. 2: Garbage First GC Layout
http://www.oracle.com/technetwork/tutorials/tutorials-1876574.html
G1 is planned as the long term replacement for the Concurrent Mark-Sweep Collector (CMS). Comparing G1 with CMS, there are differences that make G1 a better solution. One difference is that G1 is a compacting collector. G1 compacts sufficiently to completely avoid the use of fine-grained free lists for allocation, and instead relies on regions. This considerably simplifies parts of the collector, and mostly eliminates potential fragmentation issues. Also, G1 offers more predictable garbage collection pauses than the CMS collector, and allows users to specify desired pause targets.
When performing garbage collections, G1 operates in a manner similar to the CMS collector. G1 performs a concurrent global marking phase to determine the liveness of objects throughout the heap. After the mark phase completes, G1 knows which regions are mostly empty. It collects in these regions first, which usually yields a large amount of free space. This is why this method of garbage collection is called Garbage-First. As the name suggests, G1 concentrates its collection and compaction activity on the areas of the heap that are likely to be full of reclaimable objects, that is, garbage. G1 uses a pause prediction model to meet a user-defined pause time target and selects the number of regions to collect based on the specified pause time target.
The regions identified by G1 as ripe for reclamation are garbage collected using evacuation. G1 copies objects from one or more regions of the heap to a single region on the heap, and in the process both compacts and frees up memory. This evacuation is performed in parallel on multi-processors, to decrease pause times and increase throughput. Thus, with each garbage collection, G1 continuously works to reduce fragmentation, working within the user defined pause times. This is beyond the capability of both the previous methods. CMS (Concurrent Mark Sweep ) garbage collector does not do compaction. ParallelOld garbage collection performs only whole-heap compaction, which results in considerable pause times.
- Remembered Sets or RSets track object references into a given region. There is one RSet per region in the heap. The RSet enables the parallel and independent collection of a region. The overall footprint impact of RSets is less than 5%.
Collection Sets or CSets the set of regions that will be collected in a GC. All live data in a CSet is evacuated (copied/moved) during a GC. Sets of regions can be Eden, survivor, and/or old generation. CSets have a less than 1% impact on the size of the JVM.
http://www.kawabangga.com/posts/1336
http://www.cs.virginia.edu/~cs415/reading/bacon-garbage.pdf
标记清除
标记清除的方式需要对程序的对象进行两次扫描,第一次从根(Root)开始扫描,被根引用了的对象标记为不是垃圾,不是垃圾的对象引用的对象同样标记为不是垃圾,以此递归。所有不是垃圾的对象的引用都扫描完了之后。就进行第二次扫描,第一次扫描中没有得到标记的对象就是垃圾了,对此进行回收。
复制收集
复制收集的方式只需要对对象进行一次扫描。准备一个「新的空间」,从根开始,对对象进行扫,如果存在对这个对象的引用,就把它复制到「新空间中」。一次扫描结束之后,所有存在于「新空间」的对象就是所有的非垃圾对象。
这两种方式各有千秋,标记清除的方式节省内存但是两次扫描需要更多的时间,对于垃圾比例较小的情况占优势。复制收集更快速但是需要额外开辟一块用来复制的内存,对垃圾比例较大的情况占优势。特别的,复制收集有「局部性」的优点。
在复制收集的过程中,会按照对象被引用的顺序将对象复制到新空间中。于是,关系较近的对象被放在距离较近的内存空间的可能性会提高,这叫做局部性。局部性高的情况下,内存缓存会更有效地运作,程序的性能会提高。
对于标记清除,有一种标记-压缩算法的衍生算法:
对于压缩阶段,它的工作就是移动所有的可达对象到堆内存的同一个区域中,使他们紧凑的排列在一起,从而将所有非可达对象释放出来的空闲内存都集中在一起,通过这样的方式来达到减少内存碎片的目的。
它们的衍生算法
分代回收
增量回收
并行回收
引用计数
引用计数是指,针对每一个对象,保存一个对该对象的引用计数,该对象的引用增加,则相应的引用计数增加。如果对象的引用计数为零,则回收该对象。
缺点:最著名的缺点就是如果对象中存在循环引用,就无法被回收。例如,下面三个对象互相引用,但是不存在从根(Root)指向的引用,所以已经是垃圾了。但是引用计数不为0.
http://www.infoq.com/articles/Java-PERMGEN-Removed
The collection of the permanent generation would be tied to the collection of the old generation, so whenever either gets full, both the permanent generation and the old generation would be collected.
Trivia: Before JDK7, for HotSpot JVM, interned-strings were also held in the permanent generation aka PermGen, causing a vast number of performance issues and OOM errors.
The metadata has now moved to native memory to an area known as the “Metaspace”.
http://www.importnew.com/3151.html
STW 和HTTP 503
https://phabricator.wikimedia.org/T148655
https://issues.apache.org/jira/secure/attachment/12690859/HBASE-12816.patch