https://mp.weixin.qq.com/s/oBU0n0ajkjNfth-PuKQVRw
https://cloud.tencent.com/developer/article/1117438
https://blog.csdn.net/qq_35625303/article/details/79374964
记一次 HDFS NameNode GC 调优
https://blog.kaaass.net/archives/867
13.112: [GC [DefNew: 3324K->152K(3712K), 0.0023122 secs] 3324K->152K(11904K), 0.0035311 secs]
揪出一个导致GC慢慢变长的JVM设计缺陷
https://engineering.linkedin.com/blog/2016/02/eliminating-large-jvm-gc-pauses-caused-by-background-io-traffic
the following GC log snapshot shows another STW pause of 11.45 seconds. The garbage collector is CMS (Concurrent Mode Sweep). The “user”/”sys” time is negligible, however the “real” GC time is more than 11 seconds. The last line confirms the 11.45-second application stop time.
2016-01-14T22:08:28.028+0000: 312052.604: [GC (Allocation Failure) 312064.042: [ParNew
Desired survivor size 1998848 bytes, new threshold 15 (max 15)
- age 1: 1678056 bytes, 1678056 total
: 508096K->3782K(508096K), 0.0142796 secs] 1336653K->835675K(4190400K), 11.4521443 secs] [Times: user=0.18 sys=0.01, real=11.45 secs]
2016-01-14T22:08:39.481+0000: 312064.058: Total time for which application threads were stopped: 11.4566012 seconds
https://blog.gceasy.io/2016/11/15/rotating-gc-log-files/
在出入log的的时候在append中会调用sendLogEntry这个方法,而logEntries本身是个list对象,非线程安全的。这样的话,在多个线程中同时输出日志就有安全问题。于是就在sendLogEntry这个方法上加上线程安全(synchronized),上线问题解决,没有发生频繁full gc了。
但是多线程下同时调用list也不应该频繁full gc啊,这个地方有bug,但是不应该导致频繁 full gc。我怀疑是client.Log(logEntries); 这个方法本身不是线程安全的。以为我把线程同步块锁在了client.Log(logEntries);这个代码块上。发现问题也得以解决。
上面给出了总结后应该遵循的定位问题步骤。真实的查找过程绝不是按照上面的那个过程来的,这个问题的追查持续了大概两周(每天投入1-2个小时左右吧?)。主要有两个坑:
- gc log。开始的时候关注点一直在gc log上。从gc log来看根本不满足发生full gc的条件。于是专注点在认为引入的jar有在调System.gc()并没有注意到这个-XX:+DisableExplicitGC参数
- 对Error的处理。我司日志中心提供的jar居然直接忽略了Error导致了OOM日志一直没有显示出来,不然问题发生时肯定就能直接定位到了。
JVM抛出OOM之后,就算配置的是CMS,JVM仍旧是使用的Full GC来回收内存。因为CMS会有内存碎片化问题,已经发生了OOM,可能是因为没有连续内存存放新申请的对象,Full GC没有内存碎片的问题,所以直接使用Full GC回收的策略是合理的。
https://cloud.tencent.com/developer/article/1117438
https://blog.csdn.net/qq_35625303/article/details/79374964
1. 旧生代空间不足
旧生代空间只有在新生代对象转入及创建为大对象、大数组时才会出现不足的现象,当执行Full GC后空间仍然不足,则抛出如下错误:
java.lang.OutOfMemoryError: Java heap space
为避免以上两种状况引起的FullGC,调优时应尽量做到让对象在Minor GC阶段被回收、让对象在新生代多存活一段时间及不要创建过大的对象及数组。
2. Permanet Generation(永久代)空间满
PermanetGeneration中存放的为一些class的信息等,当系统中要加载的类、反射的类和调用的方法较多时,Permanet Generation可能会被占满,在未配置为采用CMS GC的情况下会执行Full GC。如果经过Full GC仍然回收不了,那么JVM会抛出如下错误信息:
java.lang.OutOfMemoryError: PermGen space
为避免Perm Gen占满造成Full GC现象,可采用的方法为增大Perm Gen空间或转为使用CMS GC。
3. CMS GC时出现promotion failed(担保:s1s2--old)和concurrent mode failure
对于采用CMS进行旧生代GC的程序而言,尤其要注意GC日志中是否有promotion failed和concurrent mode failure两种状况,当这两种状况出现时可能会触发Full GC。
promotionfailed是在进行Minor GC时,survivor space放不下、对象只能放入旧生代,而此时旧生代也放不下造成的;concurrent mode failure是在执行CMS GC的过程中同时有对象要放入旧生代,而此时旧生代空间不足造成的。
应对措施为:增大survivorspace、旧生代空间或调低触发并发GC的比率,但在JDK 5.0+、6.0+的版本中有可能会由于JDK的bug29导致CMS在remark完毕后很久才触发sweeping动作。对于这种状况,可通过设置-XX:CMSMaxAbortablePrecleanTime=5(单位为ms)来避免。
4. 统计得到的Minor GC晋升到旧生代的平均大小大于旧生代的剩余空间
这是一个较为复杂的触发情况,Hotspot为了避免由于新生代对象晋升到旧生代导致旧生代空间不足的现象,在进行Minor GC时,做了一个判断,如果之前统计所得到的Minor GC晋升到旧生代的平均大小大于旧生代的剩余空间,那么就直接触发Full GC。
例如程序第一次触发MinorGC后,有6MB的对象晋升到旧生代,那么当下一次Minor GC发生时,首先检查旧生代的剩余空间是否大于6MB,如果小于6MB,则执行Full GC。
当新生代采用PSGC时,方式稍有不同,PS GC是在Minor GC后也会检查,例如上面的例子中第一次Minor GC后,PS GC会检查此时旧生代的剩余空间是否大于6MB,如小于,则触发对旧生代的回收。
除了以上4种状况外,对于使用RMI来进行RPC或管理的Sun JDK应用而言,默认情况下会一小时执行一次Full GC。可通过在启动时通过- java-Dsun.rmi.dgc.client.gcInterval=3600000来设置Full GC执行的间隔时间或通过-XX:+ DisableExplicitGC来禁止RMI调用System.gc。
HDFS 作为大数据领域的默认分布式文件系统,其运作方式导致了非常容易碰到 GC 问题:
- 大量的元数据需要保存在内存中,使得很容易就需要几十 G 甚至 100 多 G 的堆
- 大量且高并发的文件读写操作使得频繁地产生新对象
一分钟一个点,大概每分钟有 2、3秒花在 GC 上。我们用的是经典的 ParNew + CMS 的组合,查看 GC 日志发现大部分都是新生代的 GC,也就意味着有 3% - 5%的时间是 STW 的。这个比例看着不大,但在 NameNode 每秒几 K 甚至几十 K 的事务的压力下,绝对数值和对具体业务的影响还是不能忽视的。
知道了原因,调整就很简单了。从 NameNode 的工作原理分析,大量文件的读写确实会创建很多临时对象,调大新生代就是很自然也很正确的办法。一方面,更大的新生代能减少 minor gc 的次数;另一方面,更多临时对象在新生代回收也减少了晋升到老年代的对象的数量,减少了 CMS GC 的压力。
但还有个不能忽视的问题,NameNode 的元数据会占据非常大的老年代空间,因此新生代也不能调的太大,否则可能触发频繁的 CMS GC 甚至 Full GC。
具体调多大,很显然不会有标准值,只能根据实际数据总量和 TPS 来综合考虑。好在 NameNode 每个元数据的内存占用是确定的,乘以对象数,再留些余量,就能准确计算出老年代需要的内存。剩下的就可以分给新生代了。如果余量不足,也可以考虑适当调大整个堆的大小。
除了 GC 时间变为几分之一外,GC 次数也减少了几乎一个数量级,RPC 排队时间的毛刺也减少到百毫秒级别,恶劣情况下 2 秒左右,CMS GC 的次数也减少到 10 多个小时 1 次。
我们使用的 ParNew + CMS 组合,发生 Full GC 通常有这么几种原因:
- 主动触发,比如程序调用 System.gc()
- 老年代空间不足,可能是 promotion failed 或者 concurrent mode failure 等
- 永久代空间不足
首先排除 1。而观察日志,老年代空间还很充足,也没有发现 concurrent mode failure 和 concurrent mode failure 这样的 log,Full GC 发生前全是 ParNew GC,都没有发生 CMS GC。
那就只能是 3,永久代空间不足,发生了扩容,导致发生 Full GC。
默认值是 20.75M,实在有点小,和 log 中的值对比,也确实发生了扩容,然后又再次逼近了扩容后的值。
解决方法也很简单,我们把 -XX:PermSize 调整到 256M,并把 -XX:MaxPermSize 设置成一样大,这样初始值够用,也不会再有扩容的问题。
设置上线后,再也没有出现过 Full GC。
https://blog.kaaass.net/archives/867
13.112: [GC [DefNew: 3324K->152K(3712K), 0.0023122 secs] 3324K->152K(11904K), 0.0035311 secs]
最开始的时间是自虚拟机启动后过去的时间。GC是这里垃圾收集的类型,即是否为Full GC。随后的是“GC前区域内存->GC后区域内存(区域总内存)”,然后再是GC的执行时间。这两个时间是包含而不是叠加关系。
这里要注意的是,DefNew可能会和ParNew搞混。其实DefNew就是指默认新生代收集器,也就是Serial收集器
首先是类对象。因为是对象,Class对象就存在于Java堆中……对吗?答案是否定的,Class对象并没有明确规定存在于Java堆。而事实上,Hotspot中,Class对象存放在方法区中。那么Class对象是不是就不会被回收了呢?也不是,JDK8之前方法区的实现是永久代,所以虽然条件苛刻,但是Class对象也是可以被回收的。而JDK8之后永久代被废弃,并引入了元空间。虽然元空间并不会单独回收一个类,不过,当元空间的大小达到MaxMetaspaceSize时,依旧会触发回收。嘛,不管怎样,类对象都是可以被回收的。
只要设置-Xms于-Xmx一样Java堆就不会自动扩展了。
大对象的回收周期理论上就应该更长,因为回收大对象比回收小对象更加耗时。在JVM中,大对象会直接进入老年代,而老年代的回收周期较新生代要短的很多。
方法区在JDK8之前是以永久代的形式存在的,所以那时溢出的错误提示信息是PermGen Space。而JDK8开始引入元空间之后,错误提示信息也就随之变为Metaspace了。
Java 堆分为新生代和老生代,YGC 其实就是针对新生代的垃圾回收,对象都是优先在新生代分配的,因此当新生代内存不够分配的时候就会触发垃圾回收,正常情况下可能触发一次 YGC 就可以解决问题并正常分配的,当然也有极端情况可能要进行大扫除,对整个堆进行回收,也就是我们说的 Full GC,这种情况发生就会比较悲剧了。
这里再提一下,YGC 也是会 STW(stop the world) 的,也就是会暂停整个应用,不要觉得 YGC 发生频繁不是问题。
说实话我比较不喜欢排查 YGC 的问题,因为 YGC 的日志太简单了,正常情况下只能知道新生代内存从多少变到了多少,花了多长时间,再无其它信息了。
https://engineering.linkedin.com/blog/2016/02/eliminating-large-jvm-gc-pauses-caused-by-background-io-traffic
the following GC log snapshot shows another STW pause of 11.45 seconds. The garbage collector is CMS (Concurrent Mode Sweep). The “user”/”sys” time is negligible, however the “real” GC time is more than 11 seconds. The last line confirms the 11.45-second application stop time.
2016-01-14T22:08:28.028+0000: 312052.604: [GC (Allocation Failure) 312064.042: [ParNew
Desired survivor size 1998848 bytes, new threshold 15 (max 15)
- age 1: 1678056 bytes, 1678056 total
: 508096K->3782K(508096K), 0.0142796 secs] 1336653K->835675K(4190400K), 11.4521443 secs] [Times: user=0.18 sys=0.01, real=11.45 secs]
2016-01-14T22:08:39.481+0000: 312064.058: Total time for which application threads were stopped: 11.4566012 seconds
sar -d -p 2” to gather the statistics of await (The average time (in milliseconds) for I/O requests issued to the device to be served), tps (Total number of transfers per second that were issued to physical devices), and wr_sec-per-s (Number of sectors written to the device). The average values of them are: await=421 ms, tps=305, wr_sec-per-s=302K.
Trying to understand what system calls caused the STW pauses, we used strace to profile the system calls issued by the JVM instance.
We first verified that the JVM logs GC information to files using asynchronous IO. We traced all system calls issued by the JVM since startup. The GC log file is opened in asynchronous mode and no fsync() calls are observed.
However, traces show that several asynchronous write() system calls issued by JVM have unusually large execution time. Examining the timestamps of the system calls and the JVM pauses, we found that they correlate well. In the below figures, we plot the time series of the two latencies for two minutes.
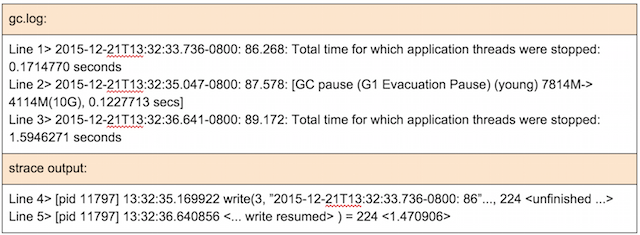
We then zoomed in to focus on the biggest pause of 1.59 seconds happening at 13:32:35. The relevant GC logs and strace output are displayed here:
Let’s try to understand what’s going on.
- At time 35.04 (line 2), a young GC starts and takes 0.12 seconds to complete.
- The young GC finishes at time 35.17 and JVM tries to output the young GC statistics to gc log file by issuing a write() system call (line 4).
- The write() call is blocked for 1.47 seconds and finally finishes at time 36.64 (line 5), taking 1.47 seconds.
- When write() call returns at 36.64 to JVM, JVM records this STW pause of 1.59 seconds (i.e., 0.12 + 1.47) (line 3).
In other words, the actual STW pause time consists of two parts: (1) GC time (e.g., young GC) and (2) GC logging time (e.g., write() time).
In other words, the actual STW pause time consists of two parts: (1) GC time (e.g., young GC) and (2) GC logging time (e.g., write() time).
These data suggest that the GC logging process is on the JVM’s STW pausing path, and the time taken for logging is part of STW pause. Specifically, the entire application pause mainly consists of two parts: pause due to JVM GC activity and pause due to OS blocking write() system call corresponding to JVM GC logging. The following diagram shows the relationship between them.
If the GC logging (i.e., write() calls) is blocked by OS, the blocking time contributes to the STW pause. The new question is why buffered writes are blocked? Digging into various resources including the kernel source code, we realized that buffered writes could be stuck in kernel code. There are multiple reasons including: (1) stable page write; and (2) journal committing.
Stable page write: JVM writing to GC log files firstly “dirties” the corresponding file cache pages. Even though the cache pages are later persisted to disk files via OS’s writeback mechanism, dirtying the cache pages in memory is still subject to a page contention caused by “stable page write.” With “stable page write,” if a page is under OS writeback, a write() to this page has to wait for the writeback to complete. The page is locked to ensure data consistency by avoiding a partially fresh page from being persisted to disk.
Journal committing: For the journaling file system, appropriate journals are generated during file writing. When appending to the GC log file results in new blocks being allocated, the file system needs to commit the journal data to disk first. During journal committing, if the OS has other IO activities, the commitment might need to wait. If the background IO activities are heavy, the waiting time can be noticeably long. Note that EXT4 file system has a feature of “delayed allocation” which postpones certain journal data to OS writeback time, which alleviates this problem. Note also that changing EXT4’s data mode from the default “ordered” mode to “writeback” does not really address this cause, as the journal needs to be persisted before write-to-extend call returns.
One solution is to put GC log files on tmpfs (i.e., -Xloggc:/tmpfs/gc.log). Since tmpfs does not have disk file backup, writing to tmpfs files does not incur disk activities, hence is not blocked by disk IO. There are two problem with this approach: (1) the GC log file will be lost after system crashes; and (2) it consumes physical memory. A remedy to this is to periodically backup the log file to persistent storage to reduce the amount of the loss.1
Another approach is to put GC log files on SSD (Solid-State Drives), which typically has much better IO performance. Depending on the IO load, SSD can be adopted as a dedicated drive for GC logging, or shared with other IO loads. However, the cost of SSD needs to be taken into consideration.
Cost-wise, rather than using SSD, a more cost-effective approach is to put GC log file on a dedicated HDD. With only the IO activity being the GC logging, the dedicated HDD likely can meet the low-pause JVM performance goal. In fact, the Scenario I we showed above can mimic such a setup, since in that setup no other IO activities exist on the GC-logging drive.