https://www.tutorialspoint.com/logstash/logstash_internal_architecture.htm


https://subscription.packtpub.com/book/big_data_and_business_intelligence/9781787281868/5/ch05lvl1sec31/logstash-architecture
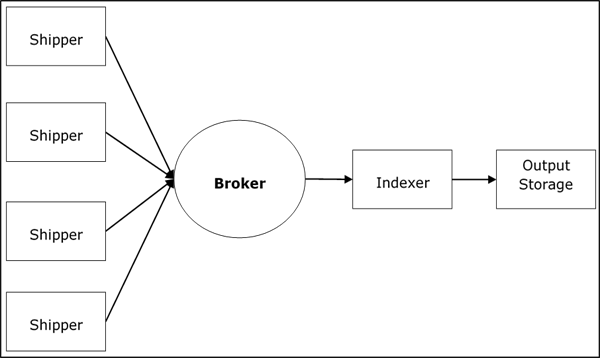
Logstash Service Architecture
Logstash processes logs from different servers and data sources and it behaves as the shipper. The shippers are used to collect the logs and these are installed in every input source. Brokers like Redis, Kafka or RabbitMQare buffers to hold the data for indexers, there may be more than one brokers as failed over instances.
Indexers like Lucene are used to index the logs for better search performance and then the output is stored in Elasticsearch or other output destination. The data in output storage is available for Kibana and other visualization software.

Logstash Internal Architecture
The Logstash pipeline consists of three components Input, Filters and Output. The input part is responsible to specify and access the input data source such as the log folder of the Apache Tomcat Server.

The Logstash event processing pipeline has three stages, they are: Inputs, Filters and Outputs. A Logstash pipeline has two required elements; input, output, and, optionally, filters:
Inputs create events, Filters modify the input events, and Outputs ship them to the destination. Inputs and outputs support codecs which enable you to encode or decode the data as and when it enters or exits the pipeline without having to use a separate filter.
Logstash uses in-memory bounded queues between pipeline stages by default (Input to Filter and Filter to Output) to buffer events. If Logstash terminates unsafely, any events that are stored in memory will be lost. To prevent data loss, you can enable Logstash to persist in-flight events to the disk by making use of persistent queues.
- send updates to multiple brokers, indexer.