Showing posts with label Company Product Architecture. Show all posts

Sunday, December 13, 2015

IFTTT Architecture


http://engineering.ifttt.com/data/2015/10/14/data-infrastructure/

Data Sources

There are three sources of data at IFTTT that are crucial for understanding the behavior of our users and performance of our Channels.
First, there’s a MySQL cluster on AWS RDS that maintains the current state of our primary application entities like users, Channels, and Recipes, along with their relations. IFTTT.com and our mobile apps run on a Rails application, backed by this instance. This data gets exported to S3 and ingested into Redshift daily using AWS Data Pipeline.
Next, as users interact with IFTTT products, we feed event data from our Rails application into our Kafka cluster.
Lastly, in order to help monitor the behavior of the hundreds of partner APIs that IFTTT connects to, we collect information about the API requests that our workers make when running Recipes. This includes metrics such as response time and HTTP status codes, and it all gets funneled into our Kafka cluster.

Kafka at IFTTT

We use Kafka as our data transport layer to achieve loose coupling between data producers and consumers. With this type of architecture, Kafka acts as an abstraction between the producers and consumers in the system. Instead of pushing data directly to consumers, producers push data to Kafka. The consumers then read data from Kafka. This makes adding new data consumers trivial.
Because Kafka acts as a log-based event stream, consumers keep track of their own position in the event stream. This enables consumers to operate in two modes: real-time and batch. It also allows consumers to reprocess data they have previously consumed, which is helpful if data needs to be reprocessed in the case of an error.
Once the data is in Kafka, we can use it for all types of purposes. Batch consumers send a copy of this data to S3 in hourly batches using Secor. Real-time consumers push data to an Elasticsearch cluster using a library we hope to open source soon.

Real-time Monitoring and Alerting

API events are stored in Elasticsearch for real-time monitoring and alerting. We useKibana to visualize the performance of our worker processes, and the performance of partner APIs in real-time.


IFTTT partners have access to the Developer Channel, a special Channel that triggers when their API is having issues. They can create Recipes using the Developer Channel that notify them using the action Channel of their choice (SMS, Email, Slack, etc).

  • Separation between producers and consumers through a data transport layer like Kafka is pure bliss, and makes the data pipeline much more resilient. For example, a few slow consumers won’t impact the performance of the other consumers or producers.
  • Use date based folder structure (YYYY/MM/DD) to store event data in permanent storage (S3 in our case). Event data stored in this way is easy to process. For example if you want to read a particular day’s data, you just need to read data from one directory.
  • Similar to the above, create time based indexes (ex: hourly) in Elasticsearch. This way if you query Elasticsearch to find all API errors in the last hour, it can find the answer by looking at a single index, increasing efficiency.
  • Rather than pushing individual events to Elasticsearch, push events in the batches (based on a time duration and/or number of events). This helps limit IO. -- batch
  • Depending on the type of data and queries you are running, it is important to optimize number of nodes, number of shards, maximum size of each shard and replication factor in Elasticsearch.
http://www.infoq.com/cn/news/2015/11/ifttt-data-infrastructure

Saturday, December 12, 2015

Pinterest - Building a scalable/available/Smartt home feed


https://medium.com/@Pinterest_Engineering/sharding-pinterest-how-we-scaled-our-mysql-fleet-3f341e96ca6f
We maintain a configuration table that says which machines these shards are on:
[{“range”:     (0,511), “master”: “MySQL001A”, “slave”: “MySQL001B”},
 {“range”: (512, 1023), “master”: “MySQL002A”, “slave”: “MySQL002B”},
    ...
 {“range”: (3584, 4095), “master”: “MySQL008A”, “slave”: “MySQL008B”}]
This config only changes when we need to move shards around or replace a host. If a master dies, we can promote the slave and then bring up a new slave. The config lives in ZooKeeper and, on update, is sent to services that maintain the MySQL shard.

Since we wanted this data to span multiple databases, we couldn’t use the database’s joins, foreign keys or indexes to gather all data, though they can be used for subqueries that don’t span databases.

All data needed to be replicated to a slave machine for backup, with high availability and dumping to S3 for MapReduce. We only interact with the master in production. You never want to read/write to a slave in production. Slaves lag, which causes strange bugs. Once you’re sharded, there’s generally no advantage to interacting with a slave in production.

We created a 64 bit ID that contains the shard ID, the type of the containing data, and where this data is in the table (local ID). The shard ID is 16 bits, type ID is 10 bits and local ID is 36 bits. The savvy additionology experts out there will notice that only adds to 62 bits. My past in compiler and chip design has taught me that reserve bits are worth their weight in gold. So we have two (set to zero).
ID = (shard ID << 46) | (type ID << 36) | (local ID<<0)
Given this Pin: https://www.pinterest.com/pin/241294492511762325/, let’s decompose the Pin ID 241294492511762325:
Shard ID = (241294492511762325 >> 46) & 0xFFFF = 3429
Type ID  = (241294492511762325 >> 36) & 0x3FF = 1
Local ID = (241294492511762325 >>  0) & 0xFFFFFFFFF = 7075733
So this Pin object lives on shard 3429. It’s type is 1 (i.e. ‘Pin’), and it’s in the row 7075733 in the pins table. For an example, let’s assume this shard is on MySQL012A. We can get to it as follows:
conn = MySQLdb.connect(host=”MySQL012A”)
conn.execute(“SELECT data FROM db03429.pins where local_id=7075733”)

There are two types of data: objects and mappings. Objects contain details, such as Pin data.

Object Tables!

Object tables, such as Pins, users, boards and comments, have an ID (the local ID, an auto-incrementing primary key) and a blob of data that contains a JSON with all the object’s data.
CREATE TABLE pins (
  local_id INT PRIMARY KEY AUTO_INCREMENT,
  data TEXT,
  ts TIMESTAMP DEFAULT CURRENT_TIMESTAMP
) ENGINE=InnoDB;
For example, a Pin object looks like this:
{“details”: “New Star Wars character”, “link”: “http://webpage.com/asdf”, “user_id”: 241294629943640797, “board_id”: 241294561224164665, …}
To create a new Pin, we gather all the data and create a JSON blob. Then, we decide on a shard ID (we prefer to choose the same shard ID as the board it’s inserted into, but that’s not necessary). The type is 1 for Pin. We connect to that database, and insert the JSON into the pins table. MySQL will give back the auto-incremented local ID. Now we have the shard, type and new local ID, so we can compose the full 64 bit ID!

A mapping table links one object to another, such as a board to the Pins on it. The MySQL table for a mapping contains three columns: a 64 bit ‘from’ ID, a 64 bit ‘to’ ID and a sequence ID. There are index keys on the (from, to, sequence) triple, and they live on the shard of the ‘from’ ID.
CREATE TABLE board_has_pins (
  board_id INT,
  pin_id INT,
  sequence INT,
  INDEX(board_id, pin_id, sequence)
) ENGINE=InnoDB;
Mapping tables are unidirectional, such as a board_has_pins table. If you need the opposite direction, you’ll need a separate pin_owned_by_board table. The sequence ID gives an ordering (our ID’s can’t be compared across shards as the new local ID offsets diverge). We usually insert new Pins into a new board with a sequence ID = unix timestamp. The sequence can be any numbers, but a unix timestamp is a convenient way to force new stuff always higher since time monotonically increases. You can look stuff up in the mapping table like this:
SELECT pin_id FROM board_has_pins 
WHERE board_id=241294561224164665 ORDER BY sequence 
LIMIT 50 OFFSET 150
This will give you up to 50 pin_ids, which you can then use to look up Pin objects.
What we’ve just done is an application layer join (board_id -> pin_ids -> pin objects). One awesome property of application layer joins is that you can cache the mapping separate from the object. We keep pin_id -> pin object cache in a memcache cluster, but we keep board_id -> pin_ids in a redis cluster. This allows us to choose the right technology to best match the object being cached.

The next way to add more capacity is to open up new ranges. Initially, we only created 4,096 shards even though our shard ID is 16 bits (64k total shards). New objects could only be created in these first 4k shards. At some point, we decided to create new MySQL servers with shards 4,096 to 8,191 and started filling those.

You lose some nice properties of the ID shard, such as spacial locality. You have to start with all shards made in the beginning and create the key yourself ( it will not make one for you). Always best to represent objects in your system with immutable IDs. That way you don’t have to update lots of references when, for instance, a user changes their username.

consider building a cluster of background processing machines (pro-tip use pyres) to script moving your data from your old databases to your shiny new shard. I guarantee that data will be missed no matter how hard you try (gremlins in the system, I swear), so repeat the data transfer over and over again until the new things being written into the new system are tiny or zero.


https://engineering.pinterest.com/blog/building-scalable-and-available-home-feed
From a Pinner’s point of view, availability means how often they’ll get errors. For service owners, availability means how many minutes the service can be down without violating SLA (service level agreement)
The Pinterest home feed is a personalized collection of Pins for each person. One third of Pinterest’s traffic lands on home feed, which makes it one of our most critical pages. When building our new home feed, achieving four nines or higher was one of the metrics used for measuring the success of the project.

Isolating challenges

The home feed system can be simplified to support three use cases: writing Pinners’ feed to a storage, serving feed from the storage and removing feed when it’s required. 
Writing feed can have a huge QPS (query per second). Fortunately it’s not user-facing and certain delay (e.g. seconds or even minutes) is tolerable. 
Serving has relatively small QPS when comparing the writing operation, but it’s user-facing and has a tight performance requirement.
A simple design can include writing all feed to a storage and serving and deleting from it. At our current scale, we keep hundreds of terabyte data and support millions of operations per second. We’ve had success with HBase in our past iterations of the home feed system. After evaluating all the options, we chose HBase as our backend storage.

The problem with the design is it’s very challenging to tune the same storage to meet the requirements for both a high volume of writing and a high performance of reading and updating. 

For example, when a person creates a new Pin, we’ll fan out the Pin to all his or her followers. Followers are sharded across all HBase regions. When we fan out the same Pin to hundreds of Pinners, the write operation will hit multiple regions, lock the WAL (write ahead log) on each region server, update it and unlock it after use. Locking the WAL for each write/update/delete operation isn’t efficient and quickly becomes a bottleneck. 

A better approach is to batch operations and push the changes to HBase once in a while, which increases the throughput of the HBase cluster dramatically. But the latency of each operation can be as high as the flush interval. For user-facing operations, our latency requirement is at millisecond level and the approach will fail us miserably.
To satisfy the different requirements, we designed a system with two HBase clusters and save data to different HBase clusters at different stages.
  • Zen is a service that provides a graph data model on top of HBase and abstracts the details of HBase operations from data producer and consumer.
  • SmartFeed worker is pushing feed from all sources (we also reference sources as pools) to HBase through Zen, and called by PinLater, an asynchronous job execution system that can tolerate certain delays and failures.
  • HBase for materialized content saves the Pins that have potentially been shown in the home feed before, and its content is accessed through Zen.
  • SmartFeed content generator is in charge of selecting new Pins from the pools, scoring and ordering them.
  • SmartFeed service is indirectly retrieving feed (content) from both of the HBase clusters, and only talks to the pools cluster through SmartFeed content generator.
When a Pinner hits their home feed:
  • SmartFeed service calls content generator to get new Pins
  • Content generator decides how many Pins should be returned and how they should be ordered in the returned result
  • Simultaneously SmartFeed service retrieves saved Pins from HBase for materialized content
  • SmartFeed service will wait for the results from the above two steps, mix and return them. (If the calls to content generator fails or timeouts, the result from step 2 will still be returned.)
  • Offline, SmartFeed service will save the new result to HBase for materialized content and delete them from HBase for pools
With this design, we separate user-facing components from non user-facing components. Since different HBase clusters have different volumes of data and usage patterns, we can scale and configure them individually to meet their needs. In reality, we have far less Pins in materialized content cluster than the cluster for pools. We can make it more reliable and faster without too much cost.
To improve the availability over four nines, we implement something called speculative execution. We always keep a hot standby HBase cluster in a different EC2 availability zone to avoid losing Pinners’ data. Any changes made to the primary HBase cluster will be synced to the standby cluster within a few hundred milliseconds. In the event of a partial failure of the primary cluster we’ll serve the data from a standby cluster. This technique helps make the whole system four nines of read availability (not write) and provides a much better Pinner experience than failing the requests. The way that the speculative execution works is:
  • Make a call to the primary cluster to retrieve data
  • If the call fails or doesn’t return within certain time, make another call to the standby cluster
  • Return the data from the cluster which returns first
With this approach, SmartFeed service will be able to return data if either of the clusters is available and the overall availability is close to the combined availability of the two clusters. The tricky part is to pick a proper waiting time. Since syncing data from the primary cluster to the standby cluster has some delay, the data returned from the standby cluster can be stale. If the waiting time is too small, Pinners will have a higher chance of getting stale data. If the waiting time is too long, Pinners have to wait unnecessarily long even if we can return results from the standby cluster much earlier. For us, we find if a call doesn’t return within time x, it’ll eventually time out in most cases. The time x is also larger than the 99.9 percentile of the call’s latency. We decided to use this as the cutoff time, which means results may be returned from the standby cluster for one out of 1,000 calls.
Another interesting finding is that the latency of the standby cluster is higher than the primary cluster because so few calls fall back to the standby cluster, and it’s in a ‘cold’ state for most of the time. To warm up the pipeline and get it ready for use, we randomly forward x percent of calls to the standby cluster and drop the result.
One time the primary HBase was down for almost one hour because of some hardware issue. Thanks to speculative execution, all home feed requests automatically failover to the standby cluster. The performance and success rate of home feed was not impacted at all during the whole HBase incident.
https://engineering.pinterest.com/blog/building-smarter-home-feed
The home feed should be a reflection of what each user cares about. Content is sourced from inputs such as people and boards the user follows, interests, and recommendations. To ensure we maintain fast, reliable and personalized home feeds, we built the smart feed with the following design values in mind:
1. Different sources of Pins should be mixed together at different rates.
2. Some Pins should be selectively dropped or deferred until a later time. Some sources may produce Pins of poor quality for a user, so instead of showing everything available immediately, we can be selective about what to show and what to hold back for a future session.
3. Pins should be arranged in the order of best-first rather than newest-first. For some sources, newer Pins are intuitively better, while for others, newness is less important.

The architecture behind smart feed

We shifted away from our previously time-ordered home feed system and onto a more flexible one. The core feature of the smart feed architecture is its separation of available, but unseen, content and content that’s already been presented to the user. We leverage knowledge of what the user hasn’t yet seen to our advantage when deciding how the feed evolves over time.

Smart feed is a composition of three independent services, each of which has a specific role in the construction of a home feed.

The role of the smart feed worker

The smart feed worker is the first to process Pins and has two primary responsibilities - to accept incoming Pins and assign some score proportional to their quality or value to the receiving user, and to remember these scored Pins in some storage for later consumption.
Essentially, the worker manages Pins as they become newly available, such as those from the repins of the people the user follows. Pins have varying value to the receiving user, so the worker is tasked with deciding the magnitude of their subjective quality.


Incoming Pins are currently obtained from three separate sources: repins made by followed users, related Pins, and Pins from followed interests. Each is scored by the worker and then inserted into a pool for that particular type of pin. Each pool is a priority queue sorted on score and belongs to a single user. Newly added Pins mix with those added before, allowing the highest quality Pins to be accessible over time at the front of the queue.
Pools can be implemented in a variety of ways so long as the priority queue requirement is met. We choose to do this by exploiting the key-based sorting of HBase. Each key is a combination of user, score and Pin such that, for any user, we may scan a list of available Pins according to their score. Newly added triples will be inserted at their appropriate location to maintain the score order. This combination of user, score, and Pin into a key value can be used to create a priority queue in other storage systems aside from HBase, a property we may use in the future depending on evolving storage requirements.

Smart feed content generator

the smart feed content generator is concerned primarily with defining what “new” means in the context of a home feed. When a user accesses the home feed, we ask the content generator for new Pins since their last visit. The generator decides the quantity, composition, and arrangement of new Pins to return in response to this request.
The content generator assembles available Pins into chunks for consumption by the user as part of their home feed. The generator is free to choose any arrangement based on a variety of input signals, and may elect to use some or all of the Pins available in the pools. Pins that are selected for inclusion in a chunk are thereafter removed from the pools so they cannot be returned as part of subsequent chunks.
The content generator is generally free to perform any rearrangements it likes, but is bound to the priority queue nature of the pools. When the generator asks for n pins from a pool, it’ll get the n highest scoring (i.e., best) Pins available. Therefore, the generator doesn’t need to concern itself with finding the best available content, but instead with how the best available content should be presented.

Smart feed service

In addition to providing high availability of the home feed, the smart feed service is responsible for combining new Pins returned by the content generator with those that previously appeared in the home feed. We can separate these into the chunk returned by the content generator and the materialized feed managed by the smart feed service.
The materialized feed represents a frozen view of the feed as it was the last time the user viewed it. To the materialized Pins we add the Pins from the content generator in the chunk. The service makes no decisions about order, instead it adds the Pins in exactly the order given by the chunk. Because it has a fairly low rate of reading and writing, the materialized feed is likely to suffer from fewer availability events. In addition, feeds can be trimmed to restrict them to a maximum size. The need for less storage means we can easily increase the availability and reliability of the materialized feed through replication and the use of faster storage hardware.
The smart feed service relies on the content generator to provide new Pins. If the generator experiences a degradation in performance, the service can gracefully handle the loss of its availability. In the event the content generator encounters an exception while generating a chunk, or if it simply takes too long to produce one, the smart feed service will return the content contained in the materialized feed. In this instance, the feed will appear to the end user as unchanged from last time. Future feed views will produce chunks as large as, or larger than, the last so that eventually the user will see new Pins.
Continuing with this project, we intend to better model users’ preferences with respect to Pins in their home feeds. Our accuracy of recommendation quality varies considerably over our user base, and we would benefit from using preference information gathered from recent interactions with the home feed. Knowledge of personal preference will also help us order home feeds so the Pins of most value can be discovered with the least amount of effort.
http://timyang.net/architecture/pinterest-feed/
Pinterest首页的Feed消息流,最早是按照用户的关注对象的Pin(类似微博)聚合后按时间进行排序(自然序,类似朋友圈),后来版本的feed系统放弃了自然序,而是根据一定规则及算法来设计,内部称之为Smart feed,其算法及架构根据其公开资料整理如下,值得业界做信息流产品的技术架构师参考。
Pinterest每个用户的首页feed都是个性化内容。Pinterest系统大约1/3流量都指向feed页面,因此它是整个系统最关键的页面之一。当工程师开发新版Smart Feed时,如何达到99.99%可用性也是衡量项目是否成功的指标之一。
Pinterest smart feed的主要算法及规则如下
  • 不同来发表来源的Pin按照不同的频次聚合。
  • 将Pin按照算法及权重有选择的去除(或延迟加载),质量较低的发表来源不必每次显示全部,系统可以有选择的决定哪些立即出现,哪些延迟显示。Pin的质量都是从当前接收用户的角度来衡量。
  • Pin排序的逻辑是最好的优先,而不是最新的优先。一些发表来源的Pin可能最新的优先,但另外一些发表来源的可能新的Pin优先级低。
Pinterest Feed如图所示主要由以下几部分构成,最左边是数据来源,最右边是用户看到的Pinterest瀑布流。中间的三个服务介绍如下。
pinterest-1

Feed worker

Feed worker职责:接收新的pin并根据接收的用户的不同赋予pin权重并保存。同一个Pin,不同的接收用户有不同的权重打分。
新的pin主要有三个来源:关注用户,相关内容,关注关系的感兴趣内容。Worker会给每个来源的pin打分之后插入到一个pool里面,每个Pool是针对单个用户的优先队列(Priority Queue,即优先级高的内容先出)。
由于Feed Worker按照接收用户的维度存储,因此所有的pin进入worker时候已经按照关注关系进行分发(即行内通常说的Feed推模式)。

Feed content generator

Feed content generator负责返回用户上次访问后新的pin。Content Generator可以返回前n条或者全部新的pin,用户获取过(即浏览过)的pin会从pool中删除。Content Generator可以将多个发表源的pin按照一定规则重新排列,但是不能改变原来的Priority Queue返回的优先顺序。即队列中高优先级的会被优先取出。

Smart feed service

物化视图用于保存用户上次feed列表的快照。此服务不需要对feed的重新排序,它将上次返回给用户的pin按照当时的顺序完整保存,由于它属于用户已阅读过的历史列表,读写较少,因此它可以提供更好的可用性。另外由于可以限制历史列表的长度,存储空间可控,因此可以更低成本来增加从库来提高访问的可用性。
Feed依赖content generator来提供新的Pin,如果content generator不可用,服务可以优雅的降级,用户仍然可以获取历史的列表,返回物化存储的结果。
Pinterest通过以上3个不同的服务,实现了对feed返回内容灵活的控制,每个服务都有自己明确的职责,达到了每个用户都具备个性化返回内容的目标。

Feed存储

Pinterest的feed存储需要解决以下几个需求:
  • 写入新发表的feed,由于Pinterest采用的是推模式,这个场景需要面临需要高的写入QPS,但用户能容忍一定的写入延迟。
  • 获取首页的物化feed列表,相对与写入的QPS要小很多,但是用户对请求的延迟容忍度低。
  • 删除feed。
可以采用简单的设计方法,比如将所有的feed写入到一个存储,可以简单实现访问、更新及删除功能。在Pinterest当前的访问规模有上百T的数据以及每秒百万访问操作。经过综合评估,选择使用HBase来实现了上述需求,Pinterest业务场景需要提供非常高的读写及更新操作,HBase同时提供较高的读写及更新访问性能。
用户发表一个新的Pin时,将Pin分发给他所有的粉丝,他的粉丝可能被shard到所有的HBase region上,因此一个分发操作可能要访问到多个region,并锁定每个region的WAL日志,然后进行更新再解锁。每次的write/delete/update操作锁定WAL非常低效,而且很快成为系统的瓶颈。更好的方法是将HBase的操作批量进行,并且可以加大HBase的吞吐能力,但另外一方面增加了访问的时延latency,如果是面向用户请求的操作,访问时延增大是不能接受的。
为了满足不同的需求,Pinterest设计使用了双HBase集群的方法,将数据在不同的阶段写入到不同的HBase集群的方法,请参考图示。
pinterest-3
Zen是一个在HBase基础上提供图(Graph)存储的服务。
SmartFeed Worker将用户发表的内容分发后通过Zen保存在HBase中,异步处理任务通过PinLater服务来调用。
SmartFeed ContentGenerator负责返回最新的Pin,并进行评分及排序。
当用户刷新请求自己首页的feed时,SmartFeed服务从Content Generator和物化存储的HBase归并数据返回给用户,如果生成服务请求超时,则系统仍然可以返回物化存储的数据给用户。在后台,SmartFeed将物化存储的数据从左边的存储删除。
在实际的场景中,物化存储HBase的数据远远要比发表池的数据要少,这样请求的速度会非常快。

Feed的高可用

使用上述设计后,系统的可用性相当于物化存储HBase的可用性。HBase集群目前存在GC卡顿的风险,还有单点故障region迁移等问题,因此使用单一的HBase集群,可用性很难保证99.99%以上。
为了解决这个问题,在另外一个EC2可用区启用一个备用集群,任何写入到主集群的数据将会在数百毫秒内同步到另外一个集群上。当主集群不可用时,可以从备用集群返回用户请求的数据。通过上述设计,整个系统的可用性达到99.99%以上(不包括写)。
pinterest-2

http://pingineering.tumblr.com/post/105293275179/building-a-scalable-and-available-home-feed
Pinnability: Machine learning in the home feed
https://engineering.pinterest.com/blog/pinnability-machine-learning-home-feed


Friday, October 23, 2015

Google Calendar Architecture


如何设计类似Google Calendar的系统
http://computer.howstuffworks.com/internet/basics/google-calendar.htm
You can choose to view the calendar by day, week, month or a view that presents just the next four days. You can also choose an "agenda" view, which presents all scheduled events as a list rather than as a calendar view.

You can also use the "repeat" function for events that occur regularly, such as a weekly meeting or annual event likebirthdays.
In Google Calendar, you can use Google's search technology to search not only your own calendars, but also any public calendar on Google's system.

One of the Web services Google takes advantage of is short message service (SMS) support. This is the format cell phones use to send text messages. Users can allow Google Calendar to send reminders via SMS to their cell phones. As a scheduled event draws near, Google Calendar sends an alert via SMS to a phone number registered by the respective user.

API as Service
Google fosters a growing community of developers who use Google's application programming interface(API) to build new programs based off Google technology. 
Google Calendar makes it pretty easy to send invitations to other people. First, you create an event in your own calendar and fill out the details. Then, you can click on the "add guests" option. This opens up a field in which you can type e-mail addresses. Once you save the event, Google Calendar sends e-mails to the invite list. As guests respond to the invite, Google Calendar displays the results within the event listing on your calendar.
If a user chooses to share or publish a calendar, other users can leave comments on event entries. This allows people to discuss upcoming appointments or debrief after a meeting. The event page becomes a forum for guests and calendar viewers.
http://www.cnblogs.com/jcli/p/calendar_recur_rule.html
设计实现一个「日历」服务产品,我觉得有两个难点,一是「重复事件规则计算」,二是「到点事件准时提醒」。


上图是设置一个重复事件的设置页面,可以看到设置项还是挺多的,有「重复类型」:按日,周,月,年重复;「重复频率」:每几天,几周....等发生一次;「重复日期」:按月重复时是「一月中的某天呢」,还是「一周中的某天呢」;「结束日期」:重复事件到什么时候结束呢。所以从Google产品功能和我们的描述可以知道想要准确描述一个「重复事件」,要具备如下几个元素:
  • 重复类型,你是按天,按周,按月,还是按年呢
  • 重复频率,即几个周期发生一次,如我每两个月去和朋友打一次球
  • 一个周期内发生的日期,比如你按周重复,那你是每周几发生呢,是周二,周四才发生,还是只周一才发生;如果是按月重复,是每月的第三个星期六发生,还是每月的23号发生呢;
  • 结束日期,即重复多久后终止事件本身。如你每个月要还房贷,也是有个最终还完的那天,比如30年后。比如每个月参加某个培训,只参加5次课堂培训就完了。
我们怎样定义「重复规则」的数据结构呢?基于重复规则的复杂性和弹性可变性(之所以说弹性可变性,因为我们不能保证自己的产品不会有一些个性化的规则,比如支持农历日历,怎样表示清明节这样的日期),用字符串表达式定义,持久化存储更为理想,就像正则表达式一样,我们可以用一个字符串表达任何丰富的信息在里面。其实对于重复事件的描述,设计,我们可以遵守一定的业界标准。在RFC2445中有详细的定义
我们先定义一个接口 Rule ,它就是根据重复事件解析后的规则引擎实例接口,它应该具有如下方法:
  • nextOccurDate: 根据传入的时间计算出以该时间为起始值的下一次事件发生的时间
  • includes(theDay): 判断指定时间是否是该事件的发生时间点系列之一
实时计算,可以理解成「无状态」的实时求值。每次根据传入的参数计算并返回。
 每次我们计算时,都没有任何上下文信息,只要知道开始时间和「重复规则配置」,实时根据公式计算出下一次的发生时间。我们分析下这个计算过程的可行性:根据事件最先发生的开始时间和当前传入的时间值,我们知道两者的时间差,然后根据「重复周期值:interval」可以知道下次发生的时间所在的周期区间。缩小在指定时间周期区间后,再根据具体的某天,某月,某年的信息,即可以算出最终的下次发生的时间点。所以从这里分析来看,好像理论上是可行的。但是有几点障碍使我觉得这种计算方法不能很完美:
  1. 这个时间差和Interval的关系在「农历计算」时我觉得没有公式计算,主要是闰月的原因。当然有一种办法,就是计算两个农历时间的差值时,一年一年的判断累加。但是我觉得这种方法不完美。
  2. 「重复次数:Count」这个值基本上实时计算不出来。为什么这么说呢,因为有些比较特殊的「重复规则」会导致忽略一些时间点。如果每月31号重复时间,在小月的时候就不会发生。还有每月的第四个星期三,有时候一个月经常没有第四个星期几发生。

枚举法

 枚举法,可以理解成「有状态」的比较计算。每次调用都是根据传入的值和「预存计算好的值」比较。
我们总是先把该重复事件所有要发生的时间线上的点都计算出来,并保存起来。以后每次调用计算方法时,只要根据传入的参数值马上知道它的上次和下次发生时间点。相比上面的「实时计算法」,它的优点显而易见:简单,快速,并且可以解决上面方法中无法处理的两点。但是缺点你也想到了:那要多少空间存储这些预计算的值? 但是任何产品,都有它的实际使用场景,我想任何人使用「日历产品」的时候我们关注的时间区间都是以今天为中心两边延伸的时间区间,而且一般这个区间不会超过1年,或者2年吧。所以我们可以先计算出以今天为中心的前后各十年(这个看你估量设置)的时间区间上所有发生时间点。
这张图看起来类有点多,但是一点都不复杂,它的层次设计也是完全按照业务模型来设计的。简要说明一下这几个类:
  • Rule 是最顶层接口,用户直接操作的也只会是这个类型,这样用户就不用知道太多细节。
  • AbstractRule 是对事件中和时间相关属性的一些基本框架方法定义。
  • OnceTimeRule 是一次性事件,即只发生一次非重复发生事件
  • AbstractRecurRule 是所有重复事件的抽象类
  • DailyRule , WeeklyRule , AbstractMonthlyRule , AbstractYearlyRule 分别代表按天,周,月,年重复事件规则。
  • GregorianMonthlyRule,LunarMonthlyRule,GregorianYearlyRule, LunarYearlyRule 分别是农历,公历的按月,按年重复事件规则
  • AbstractMutliCalendarRuleHelper,GregorianCalenarRuleHelper,LunarCalenarRuleHelper 是公历,农历规则计算中使用到的辅助类。
Code: https://github.com/hongfuli/simplecal/tree/redis

http://www.mitbbs.com/article_t1/JobHunting/32635005_0_1.html
scheduler
event
notifier
这种高度抽象的题,我觉得第一步面试官期待的是你能narrow down到一个个的基本问题。任何一个小问题都够你们讨论整个面试。
老三样 kafka cassandra spark
show and resolve conflict among multiples users' calendar
scheduling periodic event
alarm before event occurrence

new
invite
display
modify
notify
delete
email function
holiday automatic mark
提供map的link - integrate with other systems: gmail, maps, search etc
貌似还有multiple calendar

开始什么?pseudo code? flowchart? 还是coding?
这种面试对互动能力和思维活跃度的功底要求很高
平时没这种能力的 装不了几秒就趴窝了
我想先整理一下core functionality, 然后开始设计

1. what kind of fancy features they expected...
2. features cases:
1) non special
2) special

先假设是case 1), 那么basic data structures 就要列出一个list

这里又分几种cases
a)  日历最重要的结构是timing
这部分又分成几个不同的组成部分
i. 当前的年月日 系统时间里取出
ii. 未来的时间年月日
iii. 过去的年月日
iv. 历史上的今天, 也包括国家假日

1.先做features basics
2.在此基础上,其他的additional,一个一个往上加

通常basic requirement比较fixed,就那几个modules,timing这部分要设置几个分支
的模块

这个没有什么挑战度吧,就是围绕着不同时间的表达,再加上repeatable alerts,
这种topic,要稍微了解一下目前工业所hot的DB存储模式,面试的时候,往上套就行了

假设有1 billion user
每个user平均每天new一个event
平均每天读10次

那么大概每秒10k的写和100k的读
如果每个user可以使用1M的存储空间,那么total就是1PB,属于大数据了
当然实际使用的情况感觉应该没有这个大,但是potentilly还是可能的, 我感觉实际情
况100T应该是够了 (90%的user不怎么使用calendar)

从这个分析来说, Cassandra handle起来应该没什么问题,是一个不错的选择, 一般
的SQL就不适合处理这么大量了。

先分析core functionality
一般就是CRUD,这个用rest来实现就很好,frontend就先不提了,都是JS的工作
那么这步重要的是设计C*的schema

我刚才看了一下,主要的大概有这样的信息
user gmail account: String
subject: String
start_at: timestamp
end_at: timestamp
Repeat: 比较复杂,可以用map
Where: string
Description: string
Reminder: map
Guests: set

NOSQL的schema的设计一般是按照query来的, Calendar的查询最典型的就是按照时间
来查询了,所以
partition key: email
clustering key: start_at

但是同一个start_at,同一个user是可以有多个event的,所以primary key里还需要另
外一个东西,我觉得可以每个event生成一个uuid,加入到primary key中。

一般大数据了就要上NOSQL了,而NOSQL scale最好的就是C*和HBase了。

https://medium.com/adventures-in-consumer-technology/google-calendar-concept-7291a9923711
Your content will be available directly within your calendar.
Navigating dozens of apps to find your content is cumbersome and time consuming. As a consequence, platforms that bundle content from various sources have become extremely valuable and popular. A calendar platform can automatically pull relevant events from your apps, which means that you don’t have to spend time digging through those apps or manually creating events.

Your calendar will get you excited for upcoming events.
Tapping the location reveals options to view the address in Google Maps or call a car (on the day of the event). The QR code expands when tapped, making it easy to check in once you arrive at the venue. Your calendar should make you feel at ease, knowing that everything you need is instantly accessible.

Your calendar will evoke nostalgia.
Your calendar should encompass all the fun things you do, and make it easy to look back and relive your favorite experiences. In this example, a calendar event summarizes a weekend trip with friends using photos, videos, profile pictures, and a map.
Integrate and share with G+

Your calendar will suggest relevant events.
Your calendar will respond dynamically to changing contexts.
This flow demonstrates how your calendar will update automatically based on new messages you receive. In the future, you won’t have to adjust calendar events as details change. More importantly, you’ll never show up to the wrong restaurant because you missed a text.
Your calendar will help you better understand your behavior, and recommend adjustments.
https://medium.com/adventures-in-consumer-technology/facebook-events-concept-29ca03297e19#.b8c33x4lx
Facebook Messenger, Instagram, and Whatsapp show that the long-term benefits of a standalone app far outweigh the short-term costs of migration.
Tickets will be one tap away.
Events will spur activity.
Events will match preferences among friends.
Events will be integrated with your favorite services.
Google Calendar Link shows Google's Strong URL architecture
Internet Calendaring and Scheduling Core Object Specification (iCalendar)

Friday, October 16, 2015

LogStash


Interview Question:
System Design: How to sync log and search it.
http://kibana.logstash.es/content/logstash/index.html
http://kibana.logstash.es/content/logstash/scale/logstash-forwarder.html

Redis 已经帮我们解决了很多的问题,而且也很轻量,为什么我们还需要 logstash-forwarder 呢?
Redis provides simple authentication but no transport-layer encryption or authorization. This is perfectly fine in trusted environments. However, if you're connecting to Redis between datacenters you will probably want to use encryption.

Logstash 社区通常习惯用 shipper,broker 和 indexer 来描述数据流中不同进程各自的角色。如下图:
logstash arch
bin/logstash -e 'input{stdin{}}output{stdout{codec=>rubydebug}}'

每位系统管理员都肯定写过很多类似这样的命令:cat randdata | awk '{print $2}' | sort | uniq -c | tee sortdata。这个管道符 | 可以算是 Linux 世界最伟大的发明之一(另一个是“一切皆文件”)。

Logstash 就像管道符一样!
当然实际上,Logstash 是用不同的线程来实现这些的。如果你运行 top 命令然后按下 H 键,你就可以看到下面这样的输出:
logstash 很温馨的给每个线程都取了名字,输入的叫xx,过滤的叫|xx

每个 logstash 过滤插件,都会有四个方法叫 add_tag, remove_tag, add_field 和 remove_field。它们在插件过滤匹配成功时生效。

Logstash 设计了自己的 DSL —— 有点像 Puppet 的 DSL
字段是 Logstash::Event 对象的属性
如果你想在 Logstash 配置中使用字段的值,只需要把字段的名字写在中括号 [] 里就行了,这就叫字段引用。

对于 嵌套字段(也就是多维哈希表,或者叫哈希的哈希),每层的字段名都写在 [] 里就可以了。比如,你可以从 geoip 里这样获取 longitude 值(是的,这是个笨办法,实际上有单独的字段专门存这个数据的):

[geoip][location][0]
小贴士:logstash 的数组也支持倒序下标,即 [geoip][location][-1] 可以获取数组最后一个元素的值。

Logstash 还支持变量内插,在字符串里使用字段引用的方法是这样:

"the longitude is %{[geoip][location][0]}"

ogstash 还提供一个方便我们规划和书写配置的小功能。你可以直接用 bin/logstash -f /etc/logstash.d/ 来运行。logstash 会自动读取 /etc/logstash.d/ 目录下所有 *.conf 的文本文件,然后在自己内存里拼接成一个完整的大配置文件,再去执行。

logstash 列出目录下所有文件时,是字母排序的。而 logstash 配置段的 filter 和 output 都是顺序执行,所以顺序非常重要。采用多文件管理的用户,推荐采用数字编号方式命名配置文件,同时在配置中,严谨采用 if 判断限定不同日志的动作。

--configtest 或 -t
意即测试。用来测试 Logstash 读取到的配置文件语法是否能正常解析。Logstash 配置语法是用 grammar.treetop 定义的。尤其是使用了上一条提到的读取目录方式的读者,尤其要提前测试。

logstash 将所有的插件都独立拆分成 gem 包。这样,每个插件都可以独立更新,不用等待 logstash 自身做整体更新的时候才能使用了。
bin/plugin list

Input
collectd 是一个守护(daemon)进程,用来收集系统性能和提供各种存储方式来存储不同值的机制。它会在系统运行和存储信息时周期性的统计系统的相关统计信息。利用这些信息有助于查找当前系统性能瓶颈(如作为性能分析 performance analysis)和预测系统未来的 load(如能力部署capacity planning)等
http://git.verplant.org/?p=collectd.git;a=blob;hb=master;f=README
input {
 collectd {
    port => 25826 ## 端口号与发送端对应
    type => collectd
}

Logstash 使用一个名叫 FileWatch 的 Ruby Gem 库来监听文件变化。这个库支持 glob 展开文件路径,而且会记录一个叫 .sincedb 的数据库文件来跟踪被监听的日志文件的当前读取位置。
discover_interval
logstash 每隔多久去检查一次被监听的 path 下是否有新文件。默认值是 15 秒。

exclude
不想被监听的文件可以排除出去,这里跟 path 一样支持 glob 展开。

sincedb_path
sincedb_write_interval
logstash 每隔多久写一次 sincedb 文件,默认是 15 秒。

stat_interval
logstash 每隔多久检查一次被监听文件状态(是否有更新),默认是 1 秒。

start_position
logstash 从什么位置开始读取文件数据,默认是结束位置,也就是说 logstash 进程会以类似 tail -F 的形式运行。如果你是要导入原有数据,把这个设定改成 "beginning",logstash 进程就从头开始读取,有点类似 cat,但是读到最后一行不会终止,而是继续变成 tail -F。

FileWatch 只支持文件的绝对路径,而且会不自动递归目录。所以有需要的话,请用数组方式都写明具体哪些文件。
将 sincedb_path 定义为 /dev/null,则每次重启自动从头开始读)。

因为 windows 平台上没有 inode 的概念,Logstash 某些版本在 windows 平台上监听文件不是很靠谱。windows 平台上,推荐考虑使用 nxlog 作为收集端

input {
    stdin {
        add_field => {"key" => "value"}
        codec => "plain"
        tags => ["add"]
        type => "std"
    }
}
input {
    stdin {
        type => "web"
    }
}
filter {
    if [type] == "web" {
        grok {
            match => ["message", %{COMBINEDAPACHELOG}]
        }
    }
}
output {
    if "_grokparsefailure" in [tags] {
        nagios_nsca {
            nagios_status => "1"
        }
    } else {
        elasticsearch {
        }
    }
}

syslog 可能是运维领域最流行的数据传输协议了
建议在使用 LogStash::Inputs::Syslog 的时候走 TCP 协议来传输数据。

因为具体实现中,UDP 监听器只用了一个线程,而 TCP 监听器会在接收每个连接的时候都启动新的线程来处理后续步骤。

如果你已经在使用 UDP 监听器收集日志,用下行命令检查你的 UDP 接收队列大小:

# netstat -plnu | awk 'NR==1 || $4~/:514$/{print $2}'
Recv-Q
228096
228096 是 UDP 接收队列的默认最大大小,这时候 linux 内核开始丢弃数据包了!

才将这两步拆分到 filters 阶段后,logstash 支持对该阶段插件单独设置多线程运行,大大提高了总体处理性能。在相同环境下, logstash -f tcp.conf -w 20 的测试中,总体处理性能可以达到每秒 30000 条数据!

未来你可能会用 Redis 服务器或者其他的消息队列系统来作为 logstash broker 的角色。不过 Logstash 其实也有自己的 TCP/UDP 插件,在临时任务的时候,也算能用,尤其是测试环境。

input {
    tcp {
        port => 8888
        mode => "server"
        ssl_enable => false
    }
}

LogStash::Inputs::TCP 最常见的用法就是配合 nc 命令导入旧数据。在启动 logstash 进程后,在另一个终端运行如下命令即可导入数据:
# nc 127.0.0.1 8888 < olddata
这种做法比用 LogStash::Inputs::File 好,因为当 nc 命令结束,我们就知道数据导入完毕了。而用 input/file 方式,logstash 进程还会一直等待新数据输入被监听的文件,不能直接看出是否任务完成了。

编码插件(Codec)
在此之前,logstash 只支持纯文本形式输入,然后以过滤器处理它。但现在,我们可以在输入 期处理不同类型的数据,这全是因为有了 codec 设置。
所以,这里需要纠正之前的一个概念。Logstash 不只是一个input | filter | output 的数据流,而是一个 input | decode | filter | encode | output 的数据流
codec 的引入,使得 logstash 可以更好更方便的与其他有自定义数据格式的运维产品共存,比如 graphite、fluent、netflow、collectd,以及使用 msgpack、json、edn 等通用数据格式的其他产品等。


直接输入预定义好的 JSON 数据,这样就可以省略掉 filter/grok 配置
nginx.conf
logformat json '{"@timestamp":"$time_iso8601",'
               '"@version":"1",'
               '"host":"$server_addr",'
               '"client":"$remote_addr",'
               '"size":$body_bytes_sent,'
               '"responsetime":$request_time,'
               '"domain":"$host",'
               '"url":"$uri",'
               '"status":"$status"}';
access_log /var/log/nginx/access.log_json json;

Nginx 是作为一个代理服务器运行的话,访问日志里有些变量,比如说 $upstream_response_time,可能不会一直是数字,它也可能是一个 "-" 字符串!这会直接导致 logstash 对输入数据验证报异常。

有两个办法解决这个问题:
用 sed 在输入之前先替换 - 成 0。
tail -F /var/log/nginx/proxy_access.log_json \
    | sed 's/upstreamtime":-/upstreamtime":0/' \
    | /usr/local/logstash/bin/logstash -f /usr/local/logstash/etc/proxylog.conf
日志格式中统一记录为字符串格式(即都带上双引号 "),然后再在 logstash 中用 filter/mutate 插件来变更应该是数值类型的字符字段的值类型。

合并多行数据(Multiline)
input {
    stdin {
        codec => multiline {
            pattern => "^\["
            negate => true
            what => "previous"
        }
    }
}
就是把当前行的数据添加到前面一行后面,,直到新进的当前行匹配 ^\[ 正则为止。
logstash 还提供了另一种处理 log4j 的方式:input/log4j。与 codec/multiline 不同,这个插件是直接调用了 org.apache.log4j.spi.LoggingEvent 处理 TCP 端口接收的数据.

过滤器插件(Filter)
时间处理(Date)
filters/date 插件可以用来转换你的日志记录中的时间字符串,变成 LogStash::Timestamp 对象,然后转存到 @timestamp 字段里。
一般情况下数据流程中我们都会有缓冲区,导致最终的实际处理时间跟事件产生时间略有偏差。
建议打开 Nginx 的 access_log 配置项的 buffer 参数,对极限响应性能有极大提升!

UNIX, UNIX_MS.

其实,Elasticsearch 内部,对时间类型字段,是统一采用 UTC 时间,存成 long 长整形数据的. 对日志统一采用 UTC 时间存储,是国际安全/运维界的一个通识
对于页面查看,ELK 的解决方案是在 Kibana 上,读取浏览器的当前时区,然后在页面上转换时间内容的显示。
    date {
        match => ["logdate", "dd/MMM/yyyy:HH:mm:ss Z"]
    }
Grok 正则捕获
你可以在 grok 里预定义好命名正则表达式,在稍后(grok参数或者其他正则表达式里)引用它。
    grok {
        match => {
            "message" => "\s+(?<request_time>\d+(?:\.\d+)?)\s+"
        }
    }
%{PATTERN_NAME:capture_name:data_type}
data_type 目前只支持两个值:int 和 float。
把所有的 grok 表达式统一写入到一个地方。然后用 filter/grok 的 patterns_dir 选项来指明。

如果你把 "message" 里所有的信息都 grok 到不同的字段了,数据实质上就相当于是重复存储了两份。所以你可以用 remove_field 参数来删除掉 message 字段,或者用 overwrite 参数来重写默认的 message 字段,只保留最重要的部分。
    grok {
        patterns_dir => "/path/to/your/own/patterns"
        match => {
            "message" => "%{SYSLOGBASE} %{DATA:message}"
        }
        overwrite => ["message"]
    }
多行匹配
    "message" => "(?m)\s+(?<request_time>\d+(?:\.\d+)?)\s+"
GeoIP 库可以根据 IP 地址提供对应的地域信息,包括国别,省市,经纬度等,对于可视化地图和区域统计非常有用。
    geoip {
        source => "message"
    }
    geoip {
        fields => ["city_name", "continent_code", "country_code2", "country_code3", "country_name", "dma_code", "ip", "latitude", "longitude", "postal_code", "region_name", "timezone"]
    }
geoip.location 是 logstash 通过 latitude 和 longitude 额外生成的数据。所以,如果你是想要经纬度又不想重复数据的话,应该像下面这样做:

filter { geoip { fields => ["city_name", "country_code2", "country_name", "latitude", "longitude", "region_name"] remove_field => ["[geoip][latitude]", "[geoip][longitude]"] } } ```

其中只是一部分记录是 JSON 格式的。这时候,我们依然需要在 filter 阶段,单独启用 JSON 解码插件。
如果不打算使用多层结构的话,删掉 target 配置即可
    json {
        source => "message"
        target => "jsoncontent"
    }
数值统计(Metrics)
filters/metrics 插件是使用 Ruby 的 Metriks 模块来实现在内存里实时的计数和采样分析

web 访问日志的异常状态码频率是运维人员会非常关心的一个数据。通常我们的做法,是通过 logstash 或者其他日志分析脚本,把计数发送到 rrdtool 或者 graphite 里面。然后再通过 check_graphite 脚本之类的东西来检查异常并报警。
扩展方案
在生产环境中,从每台应用服务器运行 logstash 进程并将数据直接发送到 Elasticsearch 里,显然不是第一选择:第一,过多的客户端连接对 Elasticsearch 是一种额外的压力;第二,网络抖动会影响到 logstash 进程,进而影响生产应用;第三,运维人员未必愿意在生产服务器上部署 Java,或者让 logstash 跟业务代码争夺 Java 资源。

在实际运用中,logstash 进程会被分为两个不同的角色。运行在应用服务器上的,尽量减轻运行压力,只做读取和转发,这个角色叫做 shipper;运行在独立服务器上,完成数据解析处理,负责写入 Elasticsearch 的角色,叫 indexer。

利用 Redis 队列扩展 logstash
Redis 服务器是 logstash 官方推荐的 broker 选择。Broker 角色也就意味着会同时存在输入和输出俩个插件。
logstash 只是用来做消息队列
input {
    redis {
        data_type => "pattern_channel"
        key => "logstash-*"
        host => "192.168.0.2"
        port => 6379
        threads => 5
    }
}

LogStash::Inputs::Redis 支持三种 data_type(实际上是redis_type),不同的数据类型会导致实际采用不同的 Redis 命令操作:

list => BLPOP
channel => SUBSCRIBE
pattern_channel => PSUBSCRIBE

PUBLISH logstash-demochan "hello world"
PUBLISH logstash-chan '{"message":"hello world","@version":"1","@timestamp":"2014-08-08T16:34:21.865Z","host":"raochenlindeMacBook-Air.local","key1":"value1"}'

这里我们建议的是使用 pattern_channel 作为输入插件的 data_type 设置值。因为实际使用中,你的 redis 频道可能有很多不同的 keys,一般命名成 logstash-chan-%{type} 这样的形式。这时候 pattern_channel 类型就可以帮助你一次订阅全部 logstash 相关频道!

通过频道发布的一条信息,会被所有订阅了该频道的 logstash 进程同时接收到,然后输出重复内容!

这种时候,就需要用 list 类型。在这种类型下,数据输入到 redis 服务器上暂存,logstash 则连上 redis 服务器取走 (BLPOP 命令,所以只要 logstash 不堵塞,redis 服务器上也不会有数据堆积占用空间)数据。
127.0.0.1:6379> RPUSH logstash-list "hello world" "hello world" "hello world" "hello world" "hello world" "hello world"

输出到 Redis
output {
    redis {
        data_type => "channel"
        key => "logstash-chan-%{+yyyy.MM.dd}"
    }
}

SUBSCRIBE logstash-chan-2014.08.08
logstash 可以直接向 webkit 等支持 socket.io 的浏览器推送告警信息。

通过kafka传输
input {
    kafka {
        zk_connect => "localhost:2181"
        group_id => "logstash"
        topic_id => "test"
        codec => plain
        reset_beginning => false # boolean (optional), default: false
        consumer_threads => 5  # number (optional), default: 1
        decorate_events => true # boolean (optional), default: false
    }
}

rebalance_max_retries
当有新的 consumer(logstash) 加入到同一 group 时,将会 reblance ,此后将会有 partitions 的消费端迁移到新的 consumer 上,如果一个 consumer 获得了某个 partition 的消费权限,那么它将会向 zookeeper 注册, Partition Owner registry 节点信息,但是有可能此时旧的 consumer 尚没有释放此节点,此值用于控制,注册节点的重试次数。

1.想要使用多个 logstash 端协同消费同一个 topic 的话,那么需要把两个或是多个 logstash 消费端配置成相同的 group_id 和 topic_id, 但是前提是要把相应的 topic 分多个 partitions (区),多个消费者消费是无法保证消息的消费顺序性的。

这里解释下,为什么要分多个 partitions(区), kafka 的消息模型是对 topic 分区以达到分布式效果。每个 topic 下的不同的 partitions (区)只能有一个 Owner 去消费。所以只有多个分区后才能启动多个消费者,对应不同的区去消费。其中协调消费部分是由 server 端协调而成。不必使用者考虑太多。只是消息的消费则是无序的。
总结:保证消息的顺序,那就用一个 partition。 kafka 的每个 partition 只能同时被同一个 group 中的一个 consumer 消费。

 output {
    kafka {
        broker_list => "localhost:9092"
        topic_id => "test"
        compression_codec => "snappy" # string (optional), one of ["none", "gzip", "snappy"], default: "none"
    }
}
partitioner_class
分区的策略,默认是 hash 取模


https://www.elastic.co/guide/en/logstash/current/first-event.html
bin/logstash -e 'input { stdin { } } output { stdout {} }'
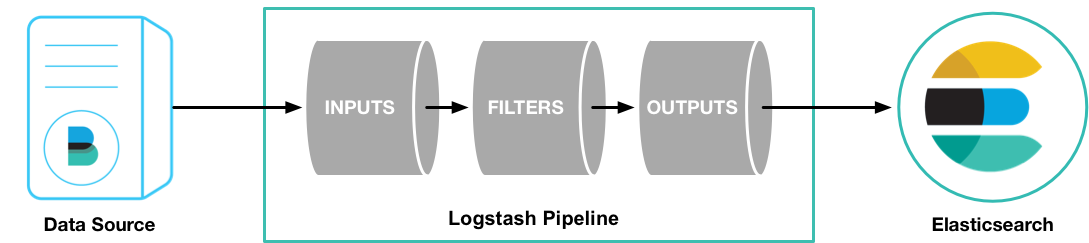
 Logstash pipeline has two required elements, input and output, and one optional element,filter. The input plugins consume data from a source, the filter plugins modify the data as you specify, and the output plugins write the data to a destination.
static/images/basic_logstash_pipeline.png
input { file { path => "/path/to/groksample.log" start_position => beginning } }
The default behavior of the file input plugin is to monitor a file for new information, in a manner similar to the UNIX tail -f command. To change this default behavior and process the entire file, we need to specify the position where Logstash starts processing the file.
Parsing Web Logs with the Grok Filter Pluginedit
filter { grok { match => { "message" => "%{COMBINEDAPACHELOG}"} } }
Indexing Parsed Data into Elasticsearch
output { elasticsearch { protocol => "http" } }
With this configuration, Logstash uses multicast discovery to connect to Elasticsearch.
bin/logstash -f first-pipeline.conf --configtest
bin/logstash -f first-pipeline.conf
Try a test query to Elasticsearch based on the fields created by the grok filter plugin: curl -XGET 'localhost:9200/logstash-$DATE/_search?q=response=401'

Multiple Input and Output Pluginsedit

The Logstash Forwarder is a lightweight, resource-friendly tool that collects logs from files on the server and forwards these logs to your Logstash instance for processing. The Logstash Forwarder uses a secure protocol called lumberjack to communicate with your Logstash instance. The lumberjack protocol is designed for reliability and low latency. The Logstash Forwarder uses the computing resources of the machine hosting the source data, and the Lumberjack input plugin minimizes the resource demands on the Logstash instance.

In a typical use case, the Logstash Forwarder client runs on a separate machine from the machine running your Logstash instance.
{ "network": { "servers": [ "localhost:5043" ], "ssl ca": "/path/to/localhost.crt", "timeout": 15 }, "files": [ { "paths": [ "/path/to/sample-log" ], "fields": { "type": "apache" } } ] }
Writing Logstash Data to a Fileedit
file { path => /path/to/target/file }
Writing to multiple Elasticsearch nodesedit
Writing to multiple Elasticsearch nodes lightens the resource demands on a given Elasticsearch node, as well as providing redundant points of entry into the cluster when a particular node is unavailable.   output {
elasticsearch { protocol => "http" host => ["IP Address 1", "IP Address 2", "IP Address 3"] } }
http://www.logstashbook.com/TheLogstashBook_sample.pdf
A Syslog message Dec 15 14:29:31 joker systemd-logind[2113]: New session 31581 of ↩ user bob. They consist of a timestamp, the host that generated the message (here joker), the process and process ID (PID) that generated the message and the content of the message.

Configuring Logstash for Syslog
input {
redis {
host => "10.0.0.1"
data_type => "list"
type => "redis-input"
key => "logstash"
}
syslog {
type => syslog
port => 5514
}
}
output {
stdout { }
elasticsearch {
cluster => "logstash"
}
}

By default most Syslog servers can use either TCP or UDP to send Syslog messages and when being used to centralize Syslog messages they generally listen on port 514

Configuring RSyslog
The RSyslog daemon has become popular on many distributions, indeed it has
become the default Syslog daemon on recent versions of Ubuntu, CentOS, Fedora,
Debian, openSuSE and others. It can process log files, handle local Syslog and
comes with an extensible modular plug-in system.
*.* @@smoker.example.com:5514

The @@ tells RSyslog to use TCP to send the messages. Specifying a single @ uses
UDP as a transport.
mac defualt: /etc/syslog.conf
install.* @127.0.0.1:32376
local7.info /var/log/McAfeeSecurity.log

Testing with logger
$ logger "This is a syslog message"
sudo /etc/init.d/syslogd restart

Using the Logstash Forwarder
The Logstash Forwarder (hereafter Forwarder) is designed to be a lightweight
client and server for sending messages to Logstash. It includes a custom-designed
protocol and unlike any of our previous transports it also includes some security
via SSL encryption of the traffic as well as compression of log traffic. Using the
Forwarder you can:
• Follow files (it also respects rename and truncation conditions like log rotation).
• Receive stdin, which is useful for things like piping output to the Forwarder.
So why use the Forwarder at all instead of say Syslog? The Forwarder is designed
to be tiny, incredibly memory conservative and very, very fast. None of the existing
Syslog servers are really designed to scale and transmit large volumes of
events and they often break down at large volumes.

lumberjack {
port => 6782
ssl_certificate => "/etc/logstash/server.crt"
ssl_key => "/etc/logstash/server.key"
type => "lumberjack"
}
sudo service logstash restart
Installing the Logstash Forwarder on the remote host
sudo dpkg -i logstash-forwarder_0.4.0_amd64.deb

{
"network": {
"servers": [ "10.0.0.1:6782" ],
"ssl ca": "/etc/server.crt",
"timeout": 15
},
"files": [
{
"paths": ["/var/log/syslog",
"/var/log/*.log"
],
"fields": { "type": "syslog" }
},
{
"paths": [
"/var/log/apache2/*.log"
],
"fields": { "type": "apache" }
}
]
}
: Starting the Forwarder on boot
$ sudo update-rc.d logstash-forwarder defaults

logstash-forwarder源码分析
logstash-forwarder 源码核心思想包括以下几个角色(模块):
prospector: 找到配文件中paths下面文件, 并且启动harvesters (负责监听文件的改变)
harvester: 读取scan文件, 并提交相应的event给spooler (负责监听文件内容的改变)
spooler: 做为一个buffer缓冲池,达到大小或者计数器时间到flush池子里面的event信息给publisher (消息缓冲池)
publisher: 连接网络(connect是通过ssl方式认证),传输event数据到指定地点, 并通知registrar传输成功 (网络传输,消息传输出去)
registrar: 记录文件的records,包括日志现在读取offset等信息,默认存放在.logstash-forwarder文件下 (保存文件读取信息)
Prospector(阻塞监听) -> harvester(阻塞监听) ->spooler(阻塞监听) ->publisher(阻塞监听)->registrar(阻塞监听)的启动过程
prospector------------
主要功能函数 遍历文件属性
func (p *Prospector) scan(path string, output chan *FileEvent, resume *ProspectorResume)
if fileinfo.ModTime().Before(p.lastscan) && time.Since(fileinfo.ModTime()) > p.FileConfig.deadtime {
                var offset int64 = 0
                var is_resuming bool = false
                if resume != nil {
                    // Call the calculator - it will process resume state if there is one
                    offset, is_resuming = p.calculate_resume(file, fileinfo, resume)
                }
                // Are we resuming a dead file? We have to resume even if dead so we catch any old updates to the file
                // This is safe as the harvester, once it hits the EOF and a timeout, will stop harvesting
                // Once we detect changes again we can resume another harvester again - this keeps number of go routines to a minimum
                if is_resuming {
                    emit("Resuming harvester on a previously harvested file: %s\n", file)
                    harvester := &Harvester{Path: file, FileConfig: p.FileConfig, Offset: offset, FinishChan: newinfo.harvester}
                    go harvester.Harvest(output)
                } else {
                    // Old file, skip it, but push offset of file size so we start from the end if this file changes and needs picking up
                    emit("Skipping file (older than dead time of %v): %s\n", p.FileConfig.deadtime, file)
                    newinfo.harvester <- fileinfo.Size()
                }
            }
             
主要执行到 go harvester.Harvest(output)

harvester------------
主要函数func (h *Harvester) Harvest(output chan *FileEvent),扫面文件
for {
        text, bytesread, err := h.readline(reader, buffer, read_timeout)
        if err != nil {
            if err == io.EOF {
                // timed out waiting for data, got eof.
                // Check to see if the file was truncated
                info, _ := h.file.Stat()
                if info.Size() < h.Offset {
                    emit("File truncated, seeking to beginning: %s\n", h.Path)
                    h.file.Seek(0, os.SEEK_SET)
                    h.Offset = 0
                } else if age := time.Since(last_read_time); age > h.FileConfig.deadtime {
                    // if last_read_time was more than dead time, this file is probably
                    // dead. Stop watching it.
                    emit("Stopping harvest of %s; last change was %v ago\n", h.Path, age)
                    return
                }
                continue
            } else {
                emit("Unexpected state reading from %s; error: %s\n", h.Path, err)
                return
            }
        }
        last_read_time = time.Now()
        line++
        event := &FileEvent{
            Source:   &h.Path,
            Offset:   h.Offset,
            Line:     line,
            Text:     text,
            Fields:   &h.FileConfig.Fields,
            fileinfo: &info,
        }
        h.Offset += int64(bytesread)
        output <- event // ship the new event downstream
    } /* forever */
     
主要执行到 output <- event
http://blog.jobbole.com/96823/
Logstash的理念很简单,它只做3件事情:
  1. Collect:数据输入
  2. Enrich:数据加工,如过滤,改写等
  3. Transport:数据输出

Logstash部署架构
  • Shipper:日志收集者。负责监控本地日志文件的变化,及时把日志文件的最新内容收集起来,输出到Redis暂存。
  • Indexer:日志存储者。负责从Redis接收日志,写入到本地文件。
  • Broker:日志Hub,用来连接多个Shipper和多个Indexer。
无论是Shipper还是Indexer,Logstash始终只做前面提到的3件事:
  • Shipper从日志文件读取最新的行文本,经过处理(这里我们会改写部分元数据),输出到Redis,
  • Indexer从Redis读取文本,经过处理(这里我们会format文本),输出到文件。
一个Logstash进程可以有多个输入源,所以一个Logstash进程可以同时读取一台服务器上的多个日志文件。Redis是Logstash官方推荐的Broker角色“人选”,支持订阅发布和队列两种数据传输模式,推荐使用。输入输出支持过滤,改写。Logstash支持多种输出源,可以配置多个输出实现数据的多份复制,也可以输出到Email,File,Tcp,或者作为其它程序的输入,又或者安装插件实现和其他系统的对接,比如搜索引擎Elasticsearch。
Logstash的运行方式为主程序+配置文件。Collect,Enrich和Transport的行为在配置文件中定义。配置文件的格式有点像json,又有点像php。
3.3. 编写Shipper角色的配置文件:shipper.conf
1
2
3
4
5
6
7
8
9
input {
    file {
        path => [
            # 这里填写需要监控的文件
            "/data/log/php/php_fetal.log",
            "/data/log/service1/access.log"
        ]
    }
}
如上,input描述的就是数据如何输入。这里填写你需要收集的本机日志文件路径。
1
2
3
4
5
6
7
8
9
10
11
12
13
output {
    # 输出到控制台
    # stdout { }
    # 输出到redis
    redis {
        host => "10.140.45.190"   # redis主机地址
        port => 6379              # redis端口号
        db => 8                   # redis数据库编号
        data_type => "channel"    # 使用发布/订阅模式
        key => "logstash_list_0"  # 发布通道名称
    }
}
如上,output描述的就是数据如何输出。这里描述的是输出到Redis。
data_type的可选值有channel和list两种。用过Redis的人知道,channel是Redis的发布/订阅通信模式,而list是Redis的队列数据结构。两者都可以用来实现系统间有序的消息异步通信。channel相比list的好处是,解除了发布者和订阅者之间的耦合。举个例子,一个Indexer在持续读取Redis中的记录,现在想加入第二个Indexer,如果使用list,就会出现上一条记录被第一个Indexer取走,而下一条记录被第二个Indexer取走的情况,两个Indexer之间产生了竞争,导致任何一方都没有读到完整的日志。channel就可以避免这种情况。这里Shipper角色的配置文件和下面将要提到的Indexer角色的配置文件中都使用了channel。
filter {
    mutate {
        # 替换元数据host的值
        replace => ["host", "10.140.46.134 B[1]"]
    }
}
如上,filter描述的是如何过滤数据。mutate是一个自带的过滤插件,它支持replace操作,可以改写数据。这里改写了元数据中的host字段,替换成了我们自己定义的文本。
Logstash传递的每条数据都带有元数据,如@version,@timestamp,host等等。有些可以修改,有些不允许修改。host记录的是当前主机的信息。Logstash可能不会去获取主机的信息或者获取的不准确,这里建议替换成自己定义的主机标示,以保证最终的日志输出可以有完美的格式和良好的可读性。
3.4 编写Indexer角色的配置文件:indexer.conf
1
2
3
4
5
6
7
8
9
input {
    redis {
        host      => "10.140.45.190"    # redis主机地址
        port      => 6379               # redis端口号
        db        => 8                  # redis数据库编号
        data_type => "channel"          # 使用发布/订阅模式
        key       => "logstash_list_0"  # 发布通道名称
    }
}
如上,input部分设置为从redis接收数据。
1
2
3
4
5
6
7
output {
    file {
        path           => "/data/log/logstash/all.log" # 指定写入文件路径
        message_format => "%{host} %{message}"         # 指定写入格式
        flush_interval => 0                            # 指定刷新间隔,0代表实时写入
    }
}
如上,output部分设置为写入本地文件。
官方文档里flush_interval为缓冲时间(单位秒)。我实践下来不是秒而是数量,Logstash会等待缓冲区写满一定数量后才输出。这对线上调试是不能接受的,建议上线初期设为0。程序稳定后,随着日志量的增大,可以增大flush_interval的值以提高文件写入性能。
Indexer的配置文件中,我明确指定了message_format的格式,其中%{host}对应的就是之前手动设置的host元数据。
3.5. 启动Logstash
1
2
# 先在Indexer主机上启动
nohup /usr/local/logstash-1.4.3/bin/logstash agent -f indexer.conf
我们来测试一下,切到Shipper主机上,模拟日志产生:
1
echo "Hello World" >> /data/log/php/php_fetal.log
再切换到Indexer主机上,如果出现:10.140.46.134 B[1] Hello World,说明Logstash部署成功。
3.6. 日志着色脚本
有些公司需要挖掘日志的价值,那仅仅收集和实时显示是不够的,需要把逼格上升到日志分析技术层面。
一个完整的日志分析技术栈需要实时收集,实时索引和展示三部分组成,Logstash只是这其中的第一个环节。Logstash所属的Elastic公司,已经开发了完整的日志分析技术栈,它们是Elasticsearch,Logstash,和Kibana,简称ELK。Elasticsearch是搜索引擎,而Kibana是Web展示界面。
日志分析技术栈


Labels

Review (572) System Design (334) System Design - Review (198) Java (189) Coding (75) Interview-System Design (65) Interview (63) Book Notes (59) Coding - Review (59) to-do (45) Linux (43) Knowledge (39) Interview-Java (35) Knowledge - Review (32) Database (31) Design Patterns (31) Big Data (29) Product Architecture (28) MultiThread (27) Soft Skills (27) Concurrency (26) Cracking Code Interview (26) Miscs (25) Distributed (24) OOD Design (24) Google (23) Career (22) Interview - Review (21) Java - Code (21) Operating System (21) Interview Q&A (20) System Design - Practice (20) Tips (19) Algorithm (17) Company - Facebook (17) Security (17) How to Ace Interview (16) Brain Teaser (14) Linux - Shell (14) Redis (14) Testing (14) Tools (14) Code Quality (13) Search (13) Spark (13) Spring (13) Company - LinkedIn (12) How to (12) Interview-Database (12) Interview-Operating System (12) Solr (12) Architecture Principles (11) Resource (10) Amazon (9) Cache (9) Git (9) Interview - MultiThread (9) Scalability (9) Trouble Shooting (9) Web Dev (9) Architecture Model (8) Better Programmer (8) Cassandra (8) Company - Uber (8) Java67 (8) Math (8) OO Design principles (8) SOLID (8) Design (7) Interview Corner (7) JVM (7) Java Basics (7) Kafka (7) Mac (7) Machine Learning (7) NoSQL (7) C++ (6) Chrome (6) File System (6) Highscalability (6) How to Better (6) Network (6) Restful (6) CareerCup (5) Code Review (5) Hash (5) How to Interview (5) JDK Source Code (5) JavaScript (5) Leetcode (5) Must Known (5) Python (5)

Popular Posts