Interview Question:
System Design: How to sync log and search it.
http://kibana.logstash.es/content/logstash/index.html
http://kibana.logstash.es/content/logstash/scale/logstash-forwarder.html
 bin/logstash -e 'input{stdin{}}output{stdout{codec=>rubydebug}}'
每位系统管理员都肯定写过很多类似这样的命令:cat randdata | awk '{print $2}' | sort | uniq -c | tee sortdata。这个管道符 | 可以算是 Linux 世界最伟大的发明之一(另一个是“一切皆文件”)。
Logstash 就像管道符一样!
当然实际上,Logstash 是用不同的线程来实现这些的。如果你运行 top 命令然后按下 H 键,你就可以看到下面这样的输出:
logstash 很温馨的给每个线程都取了名字,输入的叫xx,过滤的叫|xx
每个 logstash 过滤插件,都会有四个方法叫 add_tag, remove_tag, add_field 和 remove_field。它们在插件过滤匹配成功时生效。
Logstash 设计了自己的 DSL —— 有点像 Puppet 的 DSL
字段是 Logstash::Event 对象的属性
如果你想在 Logstash 配置中使用字段的值,只需要把字段的名字写在中括号 [] 里就行了,这就叫字段引用。
对于 嵌套字段(也就是多维哈希表,或者叫哈希的哈希),每层的字段名都写在 [] 里就可以了。比如,你可以从 geoip 里这样获取 longitude 值(是的,这是个笨办法,实际上有单独的字段专门存这个数据的):
[geoip][location][0]
小贴士:logstash 的数组也支持倒序下标,即 [geoip][location][-1] 可以获取数组最后一个元素的值。
Logstash 还支持变量内插,在字符串里使用字段引用的方法是这样:
"the longitude is %{[geoip][location][0]}"
ogstash 还提供一个方便我们规划和书写配置的小功能。你可以直接用 bin/logstash -f /etc/logstash.d/ 来运行。logstash 会自动读取 /etc/logstash.d/ 目录下所有 *.conf 的文本文件,然后在自己内存里拼接成一个完整的大配置文件,再去执行。
logstash 列出目录下所有文件时,是字母排序的。而 logstash 配置段的 filter 和 output 都是顺序执行,所以顺序非常重要。采用多文件管理的用户,推荐采用数字编号方式命名配置文件,同时在配置中,严谨采用 if 判断限定不同日志的动作。
--configtest 或 -t
意即测试。用来测试 Logstash 读取到的配置文件语法是否能正常解析。Logstash 配置语法是用 grammar.treetop 定义的。尤其是使用了上一条提到的读取目录方式的读者,尤其要提前测试。
logstash 将所有的插件都独立拆分成 gem 包。这样,每个插件都可以独立更新,不用等待 logstash 自身做整体更新的时候才能使用了。
bin/plugin list
Input
collectd 是一个守护(daemon)进程,用来收集系统性能和提供各种存储方式来存储不同值的机制。它会在系统运行和存储信息时周期性的统计系统的相关统计信息。利用这些信息有助于查找当前系统性能瓶颈(如作为性能分析 performance analysis)和预测系统未来的 load(如能力部署capacity planning)等
http://git.verplant.org/?p=collectd.git;a=blob;hb=master;f=README
input {
collectd {
port => 25826 ## 端口号与发送端对应
type => collectd
}
Logstash 使用一个名叫 FileWatch 的 Ruby Gem 库来监听文件变化。这个库支持 glob 展开文件路径,而且会记录一个叫 .sincedb 的数据库文件来跟踪被监听的日志文件的当前读取位置。
discover_interval
logstash 每隔多久去检查一次被监听的 path 下是否有新文件。默认值是 15 秒。
exclude
不想被监听的文件可以排除出去,这里跟 path 一样支持 glob 展开。
sincedb_path
sincedb_write_interval
logstash 每隔多久写一次 sincedb 文件,默认是 15 秒。
stat_interval
logstash 每隔多久检查一次被监听文件状态(是否有更新),默认是 1 秒。
start_position
logstash 从什么位置开始读取文件数据,默认是结束位置,也就是说 logstash 进程会以类似 tail -F 的形式运行。如果你是要导入原有数据,把这个设定改成 "beginning",logstash 进程就从头开始读取,有点类似 cat,但是读到最后一行不会终止,而是继续变成 tail -F。
FileWatch 只支持文件的绝对路径,而且会不自动递归目录。所以有需要的话,请用数组方式都写明具体哪些文件。
将 sincedb_path 定义为 /dev/null,则每次重启自动从头开始读)。
因为 windows 平台上没有 inode 的概念,Logstash 某些版本在 windows 平台上监听文件不是很靠谱。windows 平台上,推荐考虑使用 nxlog 作为收集端
input {
stdin {
add_field => {"key" => "value"}
codec => "plain"
tags => ["add"]
type => "std"
}
}
input {
stdin {
type => "web"
}
}
filter {
if [type] == "web" {
grok {
match => ["message", %{COMBINEDAPACHELOG}]
}
}
}
output {
if "_grokparsefailure" in [tags] {
nagios_nsca {
nagios_status => "1"
}
} else {
elasticsearch {
}
}
}
syslog 可能是运维领域最流行的数据传输协议了
建议在使用 LogStash::Inputs::Syslog 的时候走 TCP 协议来传输数据。
因为具体实现中,UDP 监听器只用了一个线程,而 TCP 监听器会在接收每个连接的时候都启动新的线程来处理后续步骤。
如果你已经在使用 UDP 监听器收集日志,用下行命令检查你的 UDP 接收队列大小:
# netstat -plnu | awk 'NR==1 || $4~/:514$/{print $2}'
Recv-Q
228096
228096 是 UDP 接收队列的默认最大大小,这时候 linux 内核开始丢弃数据包了!
才将这两步拆分到 filters 阶段后,logstash 支持对该阶段插件单独设置多线程运行,大大提高了总体处理性能。在相同环境下, logstash -f tcp.conf -w 20 的测试中,总体处理性能可以达到每秒 30000 条数据!
未来你可能会用 Redis 服务器或者其他的消息队列系统来作为 logstash broker 的角色。不过 Logstash 其实也有自己的 TCP/UDP 插件,在临时任务的时候,也算能用,尤其是测试环境。
input {
tcp {
port => 8888
mode => "server"
ssl_enable => false
}
}
LogStash::Inputs::TCP 最常见的用法就是配合 nc 命令导入旧数据。在启动 logstash 进程后,在另一个终端运行如下命令即可导入数据:
# nc 127.0.0.1 8888 < olddata
这种做法比用 LogStash::Inputs::File 好,因为当 nc 命令结束,我们就知道数据导入完毕了。而用 input/file 方式,logstash 进程还会一直等待新数据输入被监听的文件,不能直接看出是否任务完成了。
编码插件(Codec)
在此之前,logstash 只支持纯文本形式输入,然后以过滤器处理它。但现在,我们可以在输入 期处理不同类型的数据,这全是因为有了 codec 设置。
所以,这里需要纠正之前的一个概念。Logstash 不只是一个input | filter | output 的数据流,而是一个 input | decode | filter | encode | output 的数据流
codec 的引入,使得 logstash 可以更好更方便的与其他有自定义数据格式的运维产品共存,比如 graphite、fluent、netflow、collectd,以及使用 msgpack、json、edn 等通用数据格式的其他产品等。
直接输入预定义好的 JSON 数据,这样就可以省略掉 filter/grok 配置
nginx.conf
logformat json '{"@timestamp":"$time_iso8601",'
'"@version":"1",'
'"host":"$server_addr",'
'"client":"$remote_addr",'
'"size":$body_bytes_sent,'
'"responsetime":$request_time,'
'"domain":"$host",'
'"url":"$uri",'
'"status":"$status"}';
access_log /var/log/nginx/access.log_json json;
Nginx 是作为一个代理服务器运行的话,访问日志里有些变量,比如说 $upstream_response_time,可能不会一直是数字,它也可能是一个 "-" 字符串!这会直接导致 logstash 对输入数据验证报异常。
有两个办法解决这个问题:
用 sed 在输入之前先替换 - 成 0。
tail -F /var/log/nginx/proxy_access.log_json \
| sed 's/upstreamtime":-/upstreamtime":0/' \
| /usr/local/logstash/bin/logstash -f /usr/local/logstash/etc/proxylog.conf
日志格式中统一记录为字符串格式(即都带上双引号 "),然后再在 logstash 中用 filter/mutate 插件来变更应该是数值类型的字符字段的值类型。
合并多行数据(Multiline)
input {
stdin {
codec => multiline {
pattern => "^\["
negate => true
what => "previous"
}
}
}
就是把当前行的数据添加到前面一行后面,,直到新进的当前行匹配 ^\[ 正则为止。
logstash 还提供了另一种处理 log4j 的方式:input/log4j。与 codec/multiline 不同,这个插件是直接调用了 org.apache.log4j.spi.LoggingEvent 处理 TCP 端口接收的数据.
过滤器插件(Filter)
时间处理(Date)
filters/date 插件可以用来转换你的日志记录中的时间字符串,变成 LogStash::Timestamp 对象,然后转存到 @timestamp 字段里。
一般情况下数据流程中我们都会有缓冲区,导致最终的实际处理时间跟事件产生时间略有偏差。
建议打开 Nginx 的 access_log 配置项的 buffer 参数,对极限响应性能有极大提升!
UNIX, UNIX_MS.
其实,Elasticsearch 内部,对时间类型字段,是统一采用 UTC 时间,存成 long 长整形数据的. 对日志统一采用 UTC 时间存储,是国际安全/运维界的一个通识
对于页面查看,ELK 的解决方案是在 Kibana 上,读取浏览器的当前时区,然后在页面上转换时间内容的显示。
date {
match => ["logdate", "dd/MMM/yyyy:HH:mm:ss Z"]
}
Grok 正则捕获
你可以在 grok 里预定义好命名正则表达式,在稍后(grok参数或者其他正则表达式里)引用它。
grok {
match => {
"message" => "\s+(?<request_time>\d+(?:\.\d+)?)\s+"
}
}
%{PATTERN_NAME:capture_name:data_type}
data_type 目前只支持两个值:int 和 float。
把所有的 grok 表达式统一写入到一个地方。然后用 filter/grok 的 patterns_dir 选项来指明。
如果你把 "message" 里所有的信息都 grok 到不同的字段了,数据实质上就相当于是重复存储了两份。所以你可以用 remove_field 参数来删除掉 message 字段,或者用 overwrite 参数来重写默认的 message 字段,只保留最重要的部分。
grok {
patterns_dir => "/path/to/your/own/patterns"
match => {
"message" => "%{SYSLOGBASE} %{DATA:message}"
}
overwrite => ["message"]
}
多行匹配
"message" => "(?m)\s+(?<request_time>\d+(?:\.\d+)?)\s+"
GeoIP 库可以根据 IP 地址提供对应的地域信息,包括国别,省市,经纬度等,对于可视化地图和区域统计非常有用。
geoip {
source => "message"
}
geoip {
fields => ["city_name", "continent_code", "country_code2", "country_code3", "country_name", "dma_code", "ip", "latitude", "longitude", "postal_code", "region_name", "timezone"]
}
geoip.location 是 logstash 通过 latitude 和 longitude 额外生成的数据。所以,如果你是想要经纬度又不想重复数据的话,应该像下面这样做:
filter { geoip { fields => ["city_name", "country_code2", "country_name", "latitude", "longitude", "region_name"] remove_field => ["[geoip][latitude]", "[geoip][longitude]"] } } ```
其中只是一部分记录是 JSON 格式的。这时候,我们依然需要在 filter 阶段,单独启用 JSON 解码插件。
如果不打算使用多层结构的话,删掉 target 配置即可
json {
source => "message"
target => "jsoncontent"
}
数值统计(Metrics)
filters/metrics 插件是使用 Ruby 的 Metriks 模块来实现在内存里实时的计数和采样分析
web 访问日志的异常状态码频率是运维人员会非常关心的一个数据。通常我们的做法,是通过 logstash 或者其他日志分析脚本,把计数发送到 rrdtool 或者 graphite 里面。然后再通过 check_graphite 脚本之类的东西来检查异常并报警。
扩展方案
在生产环境中,从每台应用服务器运行 logstash 进程并将数据直接发送到 Elasticsearch 里,显然不是第一选择:第一,过多的客户端连接对 Elasticsearch 是一种额外的压力;第二,网络抖动会影响到 logstash 进程,进而影响生产应用;第三,运维人员未必愿意在生产服务器上部署 Java,或者让 logstash 跟业务代码争夺 Java 资源。
在实际运用中,logstash 进程会被分为两个不同的角色。运行在应用服务器上的,尽量减轻运行压力,只做读取和转发,这个角色叫做 shipper;运行在独立服务器上,完成数据解析处理,负责写入 Elasticsearch 的角色,叫 indexer。
利用 Redis 队列扩展 logstash
Redis 服务器是 logstash 官方推荐的 broker 选择。Broker 角色也就意味着会同时存在输入和输出俩个插件。
logstash 只是用来做消息队列
input {
redis {
data_type => "pattern_channel"
key => "logstash-*"
host => "192.168.0.2"
port => 6379
threads => 5
}
}
LogStash::Inputs::Redis 支持三种 data_type(实际上是redis_type),不同的数据类型会导致实际采用不同的 Redis 命令操作:
list => BLPOP
channel => SUBSCRIBE
pattern_channel => PSUBSCRIBE
PUBLISH logstash-demochan "hello world"
PUBLISH logstash-chan '{"message":"hello world","@version":"1","@timestamp":"2014-08-08T16:34:21.865Z","host":"raochenlindeMacBook-Air.local","key1":"value1"}'
这里我们建议的是使用 pattern_channel 作为输入插件的 data_type 设置值。因为实际使用中,你的 redis 频道可能有很多不同的 keys,一般命名成 logstash-chan-%{type} 这样的形式。这时候 pattern_channel 类型就可以帮助你一次订阅全部 logstash 相关频道!
通过频道发布的一条信息,会被所有订阅了该频道的 logstash 进程同时接收到,然后输出重复内容!
这种时候,就需要用 list 类型。在这种类型下,数据输入到 redis 服务器上暂存,logstash 则连上 redis 服务器取走 (BLPOP 命令,所以只要 logstash 不堵塞,redis 服务器上也不会有数据堆积占用空间)数据。
127.0.0.1:6379> RPUSH logstash-list "hello world" "hello world" "hello world" "hello world" "hello world" "hello world"
输出到 Redis
output {
redis {
data_type => "channel"
key => "logstash-chan-%{+yyyy.MM.dd}"
}
}
SUBSCRIBE logstash-chan-2014.08.08
logstash 可以直接向 webkit 等支持 socket.io 的浏览器推送告警信息。
通过kafka传输
input {
kafka {
zk_connect => "localhost:2181"
group_id => "logstash"
topic_id => "test"
codec => plain
reset_beginning => false # boolean (optional), default: false
consumer_threads => 5 # number (optional), default: 1
decorate_events => true # boolean (optional), default: false
}
}
rebalance_max_retries
当有新的 consumer(logstash) 加入到同一 group 时,将会 reblance ,此后将会有 partitions 的消费端迁移到新的 consumer 上,如果一个 consumer 获得了某个 partition 的消费权限,那么它将会向 zookeeper 注册, Partition Owner registry 节点信息,但是有可能此时旧的 consumer 尚没有释放此节点,此值用于控制,注册节点的重试次数。
1.想要使用多个 logstash 端协同消费同一个 topic 的话,那么需要把两个或是多个 logstash 消费端配置成相同的 group_id 和 topic_id, 但是前提是要把相应的 topic 分多个 partitions (区),多个消费者消费是无法保证消息的消费顺序性的。
这里解释下,为什么要分多个 partitions(区), kafka 的消息模型是对 topic 分区以达到分布式效果。每个 topic 下的不同的 partitions (区)只能有一个 Owner 去消费。所以只有多个分区后才能启动多个消费者,对应不同的区去消费。其中协调消费部分是由 server 端协调而成。不必使用者考虑太多。只是消息的消费则是无序的。
总结:保证消息的顺序,那就用一个 partition。 kafka 的每个 partition 只能同时被同一个 group 中的一个 consumer 消费。
output {
kafka {
broker_list => "localhost:9092"
topic_id => "test"
compression_codec => "snappy" # string (optional), one of ["none", "gzip", "snappy"], default: "none"
}
}
partitioner_class
分区的策略,默认是 hash 取模
https://www.elastic.co/guide/en/logstash/current/first-event.html
bin/logstash -e 'input { stdin { } } output { stdout {} }'
 input {
file {
path => "/path/to/groksample.log"
start_position => beginning
}
}
input {
file {
path => "/path/to/groksample.log"
start_position => beginning
}
}
The default behavior of the file input plugin is to monitor a file for new information, in a manner similar to the UNIX
Parsing Web Logs with the Grok Filter Pluginedit
filter { grok { match => { "message" => "%{COMBINEDAPACHELOG}"} } }
Indexing Parsed Data into Elasticsearch
output { elasticsearch { protocol => "http" } }
bin/logstash -f first-pipeline.conf
Try a test query to Elasticsearch based on the fields created by the grok filter plugin: curl -XGET 'localhost:9200/logstash-$DATE/_search?q=response=401'
Multiple Input and Output Pluginsedit
The Logstash Forwarder is a lightweight, resource-friendly tool that collects logs from files on the server and forwards these logs to your Logstash instance for processing. The Logstash Forwarder uses a secure protocol called lumberjack to communicate with your Logstash instance. The lumberjack protocol is designed for reliability and low latency. The Logstash Forwarder uses the computing resources of the machine hosting the source data, and the Lumberjack input plugin minimizes the resource demands on the Logstash instance.
In a typical use case, the Logstash Forwarder client runs on a separate machine from the machine running your Logstash instance.
{ "network": { "servers": [ "localhost:5043" ], "ssl ca": "/path/to/localhost.crt", "timeout": 15 }, "files": [ { "paths": [ "/path/to/sample-log" ], "fields": { "type": "apache" } } ] }
Writing Logstash Data to a Fileedit
file { path => /path/to/target/file }
Writing to multiple Elasticsearch nodesedit
Writing to multiple Elasticsearch nodes lightens the resource demands on a given Elasticsearch node, as well as providing redundant points of entry into the cluster when a particular node is unavailable. output {
elasticsearch { protocol => "http" host => ["IP Address 1", "IP Address 2", "IP Address 3"] } }
http://www.logstashbook.com/TheLogstashBook_sample.pdf
A Syslog message Dec 15 14:29:31 joker systemd-logind[2113]: New session 31581 of ↩ user bob. They consist of a timestamp, the host that generated the message (here joker), the process and process ID (PID) that generated the message and the content of the message.
Configuring Logstash for Syslog
input {
redis {
host => "10.0.0.1"
data_type => "list"
type => "redis-input"
key => "logstash"
}
syslog {
type => syslog
port => 5514
}
}
output {
stdout { }
elasticsearch {
cluster => "logstash"
}
}
By default most Syslog servers can use either TCP or UDP to send Syslog messages and when being used to centralize Syslog messages they generally listen on port 514
Configuring RSyslog
The RSyslog daemon has become popular on many distributions, indeed it has
become the default Syslog daemon on recent versions of Ubuntu, CentOS, Fedora,
Debian, openSuSE and others. It can process log files, handle local Syslog and
comes with an extensible modular plug-in system.
*.* @@smoker.example.com:5514
The @@ tells RSyslog to use TCP to send the messages. Specifying a single @ uses
UDP as a transport.
mac defualt: /etc/syslog.conf
install.* @127.0.0.1:32376
local7.info /var/log/McAfeeSecurity.log
Testing with logger
$ logger "This is a syslog message"
sudo /etc/init.d/syslogd restart
Using the Logstash Forwarder
The Logstash Forwarder (hereafter Forwarder) is designed to be a lightweight
client and server for sending messages to Logstash. It includes a custom-designed
protocol and unlike any of our previous transports it also includes some security
via SSL encryption of the traffic as well as compression of log traffic. Using the
Forwarder you can:
• Follow files (it also respects rename and truncation conditions like log rotation).
• Receive stdin, which is useful for things like piping output to the Forwarder.
So why use the Forwarder at all instead of say Syslog? The Forwarder is designed
to be tiny, incredibly memory conservative and very, very fast. None of the existing
Syslog servers are really designed to scale and transmit large volumes of
events and they often break down at large volumes.
lumberjack {
port => 6782
ssl_certificate => "/etc/logstash/server.crt"
ssl_key => "/etc/logstash/server.key"
type => "lumberjack"
}
sudo service logstash restart
Installing the Logstash Forwarder on the remote host
sudo dpkg -i logstash-forwarder_0.4.0_amd64.deb
{
"network": {
"servers": [ "10.0.0.1:6782" ],
"ssl ca": "/etc/server.crt",
"timeout": 15
},
"files": [
{
"paths": ["/var/log/syslog",
"/var/log/*.log"
],
"fields": { "type": "syslog" }
},
{
"paths": [
"/var/log/apache2/*.log"
],
"fields": { "type": "apache" }
}
]
}
: Starting the Forwarder on boot
$ sudo update-rc.d logstash-forwarder defaults
logstash-forwarder源码分析
http://blog.jobbole.com/96823/


System Design: How to sync log and search it.
http://kibana.logstash.es/content/logstash/index.html
http://kibana.logstash.es/content/logstash/scale/logstash-forwarder.html
Redis 已经帮我们解决了很多的问题,而且也很轻量,为什么我们还需要 logstash-forwarder 呢?
Redis provides simple authentication but no transport-layer encryption or authorization. This is perfectly fine in trusted environments. However, if you're connecting to Redis between datacenters you will probably want to use encryption.
Logstash 社区通常习惯用 shipper,broker 和 indexer 来描述数据流中不同进程各自的角色。如下图:
每位系统管理员都肯定写过很多类似这样的命令:cat randdata | awk '{print $2}' | sort | uniq -c | tee sortdata。这个管道符 | 可以算是 Linux 世界最伟大的发明之一(另一个是“一切皆文件”)。
Logstash 就像管道符一样!
当然实际上,Logstash 是用不同的线程来实现这些的。如果你运行 top 命令然后按下 H 键,你就可以看到下面这样的输出:
logstash 很温馨的给每个线程都取了名字,输入的叫xx,过滤的叫|xx
每个 logstash 过滤插件,都会有四个方法叫 add_tag, remove_tag, add_field 和 remove_field。它们在插件过滤匹配成功时生效。
Logstash 设计了自己的 DSL —— 有点像 Puppet 的 DSL
字段是 Logstash::Event 对象的属性
如果你想在 Logstash 配置中使用字段的值,只需要把字段的名字写在中括号 [] 里就行了,这就叫字段引用。
对于 嵌套字段(也就是多维哈希表,或者叫哈希的哈希),每层的字段名都写在 [] 里就可以了。比如,你可以从 geoip 里这样获取 longitude 值(是的,这是个笨办法,实际上有单独的字段专门存这个数据的):
[geoip][location][0]
小贴士:logstash 的数组也支持倒序下标,即 [geoip][location][-1] 可以获取数组最后一个元素的值。
Logstash 还支持变量内插,在字符串里使用字段引用的方法是这样:
"the longitude is %{[geoip][location][0]}"
ogstash 还提供一个方便我们规划和书写配置的小功能。你可以直接用 bin/logstash -f /etc/logstash.d/ 来运行。logstash 会自动读取 /etc/logstash.d/ 目录下所有 *.conf 的文本文件,然后在自己内存里拼接成一个完整的大配置文件,再去执行。
logstash 列出目录下所有文件时,是字母排序的。而 logstash 配置段的 filter 和 output 都是顺序执行,所以顺序非常重要。采用多文件管理的用户,推荐采用数字编号方式命名配置文件,同时在配置中,严谨采用 if 判断限定不同日志的动作。
--configtest 或 -t
意即测试。用来测试 Logstash 读取到的配置文件语法是否能正常解析。Logstash 配置语法是用 grammar.treetop 定义的。尤其是使用了上一条提到的读取目录方式的读者,尤其要提前测试。
logstash 将所有的插件都独立拆分成 gem 包。这样,每个插件都可以独立更新,不用等待 logstash 自身做整体更新的时候才能使用了。
bin/plugin list
Input
collectd 是一个守护(daemon)进程,用来收集系统性能和提供各种存储方式来存储不同值的机制。它会在系统运行和存储信息时周期性的统计系统的相关统计信息。利用这些信息有助于查找当前系统性能瓶颈(如作为性能分析 performance analysis)和预测系统未来的 load(如能力部署capacity planning)等
http://git.verplant.org/?p=collectd.git;a=blob;hb=master;f=README
input {
collectd {
port => 25826 ## 端口号与发送端对应
type => collectd
}
Logstash 使用一个名叫 FileWatch 的 Ruby Gem 库来监听文件变化。这个库支持 glob 展开文件路径,而且会记录一个叫 .sincedb 的数据库文件来跟踪被监听的日志文件的当前读取位置。
discover_interval
logstash 每隔多久去检查一次被监听的 path 下是否有新文件。默认值是 15 秒。
exclude
不想被监听的文件可以排除出去,这里跟 path 一样支持 glob 展开。
sincedb_path
sincedb_write_interval
logstash 每隔多久写一次 sincedb 文件,默认是 15 秒。
stat_interval
logstash 每隔多久检查一次被监听文件状态(是否有更新),默认是 1 秒。
start_position
logstash 从什么位置开始读取文件数据,默认是结束位置,也就是说 logstash 进程会以类似 tail -F 的形式运行。如果你是要导入原有数据,把这个设定改成 "beginning",logstash 进程就从头开始读取,有点类似 cat,但是读到最后一行不会终止,而是继续变成 tail -F。
FileWatch 只支持文件的绝对路径,而且会不自动递归目录。所以有需要的话,请用数组方式都写明具体哪些文件。
将 sincedb_path 定义为 /dev/null,则每次重启自动从头开始读)。
因为 windows 平台上没有 inode 的概念,Logstash 某些版本在 windows 平台上监听文件不是很靠谱。windows 平台上,推荐考虑使用 nxlog 作为收集端
input {
stdin {
add_field => {"key" => "value"}
codec => "plain"
tags => ["add"]
type => "std"
}
}
input {
stdin {
type => "web"
}
}
filter {
if [type] == "web" {
grok {
match => ["message", %{COMBINEDAPACHELOG}]
}
}
}
output {
if "_grokparsefailure" in [tags] {
nagios_nsca {
nagios_status => "1"
}
} else {
elasticsearch {
}
}
}
syslog 可能是运维领域最流行的数据传输协议了
建议在使用 LogStash::Inputs::Syslog 的时候走 TCP 协议来传输数据。
因为具体实现中,UDP 监听器只用了一个线程,而 TCP 监听器会在接收每个连接的时候都启动新的线程来处理后续步骤。
如果你已经在使用 UDP 监听器收集日志,用下行命令检查你的 UDP 接收队列大小:
# netstat -plnu | awk 'NR==1 || $4~/:514$/{print $2}'
Recv-Q
228096
228096 是 UDP 接收队列的默认最大大小,这时候 linux 内核开始丢弃数据包了!
才将这两步拆分到 filters 阶段后,logstash 支持对该阶段插件单独设置多线程运行,大大提高了总体处理性能。在相同环境下, logstash -f tcp.conf -w 20 的测试中,总体处理性能可以达到每秒 30000 条数据!
未来你可能会用 Redis 服务器或者其他的消息队列系统来作为 logstash broker 的角色。不过 Logstash 其实也有自己的 TCP/UDP 插件,在临时任务的时候,也算能用,尤其是测试环境。
input {
tcp {
port => 8888
mode => "server"
ssl_enable => false
}
}
LogStash::Inputs::TCP 最常见的用法就是配合 nc 命令导入旧数据。在启动 logstash 进程后,在另一个终端运行如下命令即可导入数据:
# nc 127.0.0.1 8888 < olddata
这种做法比用 LogStash::Inputs::File 好,因为当 nc 命令结束,我们就知道数据导入完毕了。而用 input/file 方式,logstash 进程还会一直等待新数据输入被监听的文件,不能直接看出是否任务完成了。
编码插件(Codec)
在此之前,logstash 只支持纯文本形式输入,然后以过滤器处理它。但现在,我们可以在输入 期处理不同类型的数据,这全是因为有了 codec 设置。
所以,这里需要纠正之前的一个概念。Logstash 不只是一个input | filter | output 的数据流,而是一个 input | decode | filter | encode | output 的数据流
codec 的引入,使得 logstash 可以更好更方便的与其他有自定义数据格式的运维产品共存,比如 graphite、fluent、netflow、collectd,以及使用 msgpack、json、edn 等通用数据格式的其他产品等。
直接输入预定义好的 JSON 数据,这样就可以省略掉 filter/grok 配置
nginx.conf
logformat json '{"@timestamp":"$time_iso8601",'
'"@version":"1",'
'"host":"$server_addr",'
'"client":"$remote_addr",'
'"size":$body_bytes_sent,'
'"responsetime":$request_time,'
'"domain":"$host",'
'"url":"$uri",'
'"status":"$status"}';
access_log /var/log/nginx/access.log_json json;
Nginx 是作为一个代理服务器运行的话,访问日志里有些变量,比如说 $upstream_response_time,可能不会一直是数字,它也可能是一个 "-" 字符串!这会直接导致 logstash 对输入数据验证报异常。
有两个办法解决这个问题:
用 sed 在输入之前先替换 - 成 0。
tail -F /var/log/nginx/proxy_access.log_json \
| sed 's/upstreamtime":-/upstreamtime":0/' \
| /usr/local/logstash/bin/logstash -f /usr/local/logstash/etc/proxylog.conf
日志格式中统一记录为字符串格式(即都带上双引号 "),然后再在 logstash 中用 filter/mutate 插件来变更应该是数值类型的字符字段的值类型。
合并多行数据(Multiline)
input {
stdin {
codec => multiline {
pattern => "^\["
negate => true
what => "previous"
}
}
}
就是把当前行的数据添加到前面一行后面,,直到新进的当前行匹配 ^\[ 正则为止。
logstash 还提供了另一种处理 log4j 的方式:input/log4j。与 codec/multiline 不同,这个插件是直接调用了 org.apache.log4j.spi.LoggingEvent 处理 TCP 端口接收的数据.
过滤器插件(Filter)
时间处理(Date)
filters/date 插件可以用来转换你的日志记录中的时间字符串,变成 LogStash::Timestamp 对象,然后转存到 @timestamp 字段里。
一般情况下数据流程中我们都会有缓冲区,导致最终的实际处理时间跟事件产生时间略有偏差。
建议打开 Nginx 的 access_log 配置项的 buffer 参数,对极限响应性能有极大提升!
UNIX, UNIX_MS.
其实,Elasticsearch 内部,对时间类型字段,是统一采用 UTC 时间,存成 long 长整形数据的. 对日志统一采用 UTC 时间存储,是国际安全/运维界的一个通识
对于页面查看,ELK 的解决方案是在 Kibana 上,读取浏览器的当前时区,然后在页面上转换时间内容的显示。
date {
match => ["logdate", "dd/MMM/yyyy:HH:mm:ss Z"]
}
Grok 正则捕获
你可以在 grok 里预定义好命名正则表达式,在稍后(grok参数或者其他正则表达式里)引用它。
grok {
match => {
"message" => "\s+(?<request_time>\d+(?:\.\d+)?)\s+"
}
}
%{PATTERN_NAME:capture_name:data_type}
data_type 目前只支持两个值:int 和 float。
把所有的 grok 表达式统一写入到一个地方。然后用 filter/grok 的 patterns_dir 选项来指明。
如果你把 "message" 里所有的信息都 grok 到不同的字段了,数据实质上就相当于是重复存储了两份。所以你可以用 remove_field 参数来删除掉 message 字段,或者用 overwrite 参数来重写默认的 message 字段,只保留最重要的部分。
grok {
patterns_dir => "/path/to/your/own/patterns"
match => {
"message" => "%{SYSLOGBASE} %{DATA:message}"
}
overwrite => ["message"]
}
多行匹配
"message" => "(?m)\s+(?<request_time>\d+(?:\.\d+)?)\s+"
GeoIP 库可以根据 IP 地址提供对应的地域信息,包括国别,省市,经纬度等,对于可视化地图和区域统计非常有用。
geoip {
source => "message"
}
geoip {
fields => ["city_name", "continent_code", "country_code2", "country_code3", "country_name", "dma_code", "ip", "latitude", "longitude", "postal_code", "region_name", "timezone"]
}
geoip.location 是 logstash 通过 latitude 和 longitude 额外生成的数据。所以,如果你是想要经纬度又不想重复数据的话,应该像下面这样做:
filter { geoip { fields => ["city_name", "country_code2", "country_name", "latitude", "longitude", "region_name"] remove_field => ["[geoip][latitude]", "[geoip][longitude]"] } } ```
其中只是一部分记录是 JSON 格式的。这时候,我们依然需要在 filter 阶段,单独启用 JSON 解码插件。
如果不打算使用多层结构的话,删掉 target 配置即可
json {
source => "message"
target => "jsoncontent"
}
数值统计(Metrics)
filters/metrics 插件是使用 Ruby 的 Metriks 模块来实现在内存里实时的计数和采样分析
web 访问日志的异常状态码频率是运维人员会非常关心的一个数据。通常我们的做法,是通过 logstash 或者其他日志分析脚本,把计数发送到 rrdtool 或者 graphite 里面。然后再通过 check_graphite 脚本之类的东西来检查异常并报警。
扩展方案
在生产环境中,从每台应用服务器运行 logstash 进程并将数据直接发送到 Elasticsearch 里,显然不是第一选择:第一,过多的客户端连接对 Elasticsearch 是一种额外的压力;第二,网络抖动会影响到 logstash 进程,进而影响生产应用;第三,运维人员未必愿意在生产服务器上部署 Java,或者让 logstash 跟业务代码争夺 Java 资源。
在实际运用中,logstash 进程会被分为两个不同的角色。运行在应用服务器上的,尽量减轻运行压力,只做读取和转发,这个角色叫做 shipper;运行在独立服务器上,完成数据解析处理,负责写入 Elasticsearch 的角色,叫 indexer。
利用 Redis 队列扩展 logstash
Redis 服务器是 logstash 官方推荐的 broker 选择。Broker 角色也就意味着会同时存在输入和输出俩个插件。
logstash 只是用来做消息队列
input {
redis {
data_type => "pattern_channel"
key => "logstash-*"
host => "192.168.0.2"
port => 6379
threads => 5
}
}
LogStash::Inputs::Redis 支持三种 data_type(实际上是redis_type),不同的数据类型会导致实际采用不同的 Redis 命令操作:
list => BLPOP
channel => SUBSCRIBE
pattern_channel => PSUBSCRIBE
PUBLISH logstash-demochan "hello world"
PUBLISH logstash-chan '{"message":"hello world","@version":"1","@timestamp":"2014-08-08T16:34:21.865Z","host":"raochenlindeMacBook-Air.local","key1":"value1"}'
这里我们建议的是使用 pattern_channel 作为输入插件的 data_type 设置值。因为实际使用中,你的 redis 频道可能有很多不同的 keys,一般命名成 logstash-chan-%{type} 这样的形式。这时候 pattern_channel 类型就可以帮助你一次订阅全部 logstash 相关频道!
通过频道发布的一条信息,会被所有订阅了该频道的 logstash 进程同时接收到,然后输出重复内容!
这种时候,就需要用 list 类型。在这种类型下,数据输入到 redis 服务器上暂存,logstash 则连上 redis 服务器取走 (BLPOP 命令,所以只要 logstash 不堵塞,redis 服务器上也不会有数据堆积占用空间)数据。
127.0.0.1:6379> RPUSH logstash-list "hello world" "hello world" "hello world" "hello world" "hello world" "hello world"
输出到 Redis
output {
redis {
data_type => "channel"
key => "logstash-chan-%{+yyyy.MM.dd}"
}
}
SUBSCRIBE logstash-chan-2014.08.08
logstash 可以直接向 webkit 等支持 socket.io 的浏览器推送告警信息。
通过kafka传输
input {
kafka {
zk_connect => "localhost:2181"
group_id => "logstash"
topic_id => "test"
codec => plain
reset_beginning => false # boolean (optional), default: false
consumer_threads => 5 # number (optional), default: 1
decorate_events => true # boolean (optional), default: false
}
}
rebalance_max_retries
当有新的 consumer(logstash) 加入到同一 group 时,将会 reblance ,此后将会有 partitions 的消费端迁移到新的 consumer 上,如果一个 consumer 获得了某个 partition 的消费权限,那么它将会向 zookeeper 注册, Partition Owner registry 节点信息,但是有可能此时旧的 consumer 尚没有释放此节点,此值用于控制,注册节点的重试次数。
1.想要使用多个 logstash 端协同消费同一个 topic 的话,那么需要把两个或是多个 logstash 消费端配置成相同的 group_id 和 topic_id, 但是前提是要把相应的 topic 分多个 partitions (区),多个消费者消费是无法保证消息的消费顺序性的。
这里解释下,为什么要分多个 partitions(区), kafka 的消息模型是对 topic 分区以达到分布式效果。每个 topic 下的不同的 partitions (区)只能有一个 Owner 去消费。所以只有多个分区后才能启动多个消费者,对应不同的区去消费。其中协调消费部分是由 server 端协调而成。不必使用者考虑太多。只是消息的消费则是无序的。
总结:保证消息的顺序,那就用一个 partition。 kafka 的每个 partition 只能同时被同一个 group 中的一个 consumer 消费。
output {
kafka {
broker_list => "localhost:9092"
topic_id => "test"
compression_codec => "snappy" # string (optional), one of ["none", "gzip", "snappy"], default: "none"
}
}
partitioner_class
分区的策略,默认是 hash 取模
https://www.elastic.co/guide/en/logstash/current/first-event.html
bin/logstash -e 'input { stdin { } } output { stdout {} }'
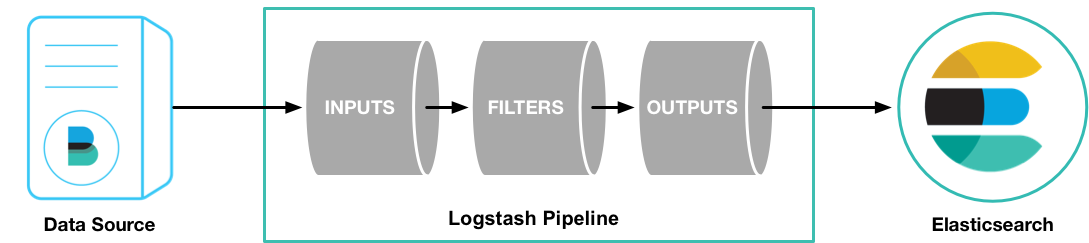
Logstash pipeline has two required elements,
input and output, and one optional element,filter. The input plugins consume data from a source, the filter plugins modify the data as you specify, and the output plugins write the data to a destination.The default behavior of the file input plugin is to monitor a file for new information, in a manner similar to the UNIX
tail -f command. To change this default behavior and process the entire file, we need to specify the position where Logstash starts processing the file.Parsing Web Logs with the Grok Filter Pluginedit
filter { grok { match => { "message" => "%{COMBINEDAPACHELOG}"} } }
Indexing Parsed Data into Elasticsearch
output { elasticsearch { protocol => "http" } }
With this configuration, Logstash uses multicast discovery to connect to Elasticsearch.
bin/logstash -f first-pipeline.conf --configtestbin/logstash -f first-pipeline.conf
Try a test query to Elasticsearch based on the fields created by the grok filter plugin: curl -XGET 'localhost:9200/logstash-$DATE/_search?q=response=401'
Multiple Input and Output Pluginsedit
The Logstash Forwarder is a lightweight, resource-friendly tool that collects logs from files on the server and forwards these logs to your Logstash instance for processing. The Logstash Forwarder uses a secure protocol called lumberjack to communicate with your Logstash instance. The lumberjack protocol is designed for reliability and low latency. The Logstash Forwarder uses the computing resources of the machine hosting the source data, and the Lumberjack input plugin minimizes the resource demands on the Logstash instance.
In a typical use case, the Logstash Forwarder client runs on a separate machine from the machine running your Logstash instance.
{ "network": { "servers": [ "localhost:5043" ], "ssl ca": "/path/to/localhost.crt", "timeout": 15 }, "files": [ { "paths": [ "/path/to/sample-log" ], "fields": { "type": "apache" } } ] }
Writing Logstash Data to a Fileedit
file { path => /path/to/target/file }
Writing to multiple Elasticsearch nodesedit
Writing to multiple Elasticsearch nodes lightens the resource demands on a given Elasticsearch node, as well as providing redundant points of entry into the cluster when a particular node is unavailable. output {
elasticsearch { protocol => "http" host => ["IP Address 1", "IP Address 2", "IP Address 3"] } }
http://www.logstashbook.com/TheLogstashBook_sample.pdf
A Syslog message Dec 15 14:29:31 joker systemd-logind[2113]: New session 31581 of ↩ user bob. They consist of a timestamp, the host that generated the message (here joker), the process and process ID (PID) that generated the message and the content of the message.
Configuring Logstash for Syslog
input {
redis {
host => "10.0.0.1"
data_type => "list"
type => "redis-input"
key => "logstash"
}
syslog {
type => syslog
port => 5514
}
}
output {
stdout { }
elasticsearch {
cluster => "logstash"
}
}
By default most Syslog servers can use either TCP or UDP to send Syslog messages and when being used to centralize Syslog messages they generally listen on port 514
Configuring RSyslog
The RSyslog daemon has become popular on many distributions, indeed it has
become the default Syslog daemon on recent versions of Ubuntu, CentOS, Fedora,
Debian, openSuSE and others. It can process log files, handle local Syslog and
comes with an extensible modular plug-in system.
*.* @@smoker.example.com:5514
The @@ tells RSyslog to use TCP to send the messages. Specifying a single @ uses
UDP as a transport.
mac defualt: /etc/syslog.conf
install.* @127.0.0.1:32376
local7.info /var/log/McAfeeSecurity.log
Testing with logger
$ logger "This is a syslog message"
sudo /etc/init.d/syslogd restart
Using the Logstash Forwarder
The Logstash Forwarder (hereafter Forwarder) is designed to be a lightweight
client and server for sending messages to Logstash. It includes a custom-designed
protocol and unlike any of our previous transports it also includes some security
via SSL encryption of the traffic as well as compression of log traffic. Using the
Forwarder you can:
• Follow files (it also respects rename and truncation conditions like log rotation).
• Receive stdin, which is useful for things like piping output to the Forwarder.
So why use the Forwarder at all instead of say Syslog? The Forwarder is designed
to be tiny, incredibly memory conservative and very, very fast. None of the existing
Syslog servers are really designed to scale and transmit large volumes of
events and they often break down at large volumes.
lumberjack {
port => 6782
ssl_certificate => "/etc/logstash/server.crt"
ssl_key => "/etc/logstash/server.key"
type => "lumberjack"
}
sudo service logstash restart
Installing the Logstash Forwarder on the remote host
sudo dpkg -i logstash-forwarder_0.4.0_amd64.deb
{
"network": {
"servers": [ "10.0.0.1:6782" ],
"ssl ca": "/etc/server.crt",
"timeout": 15
},
"files": [
{
"paths": ["/var/log/syslog",
"/var/log/*.log"
],
"fields": { "type": "syslog" }
},
{
"paths": [
"/var/log/apache2/*.log"
],
"fields": { "type": "apache" }
}
]
}
: Starting the Forwarder on boot
$ sudo update-rc.d logstash-forwarder defaults
logstash-forwarder源码分析
logstash-forwarder 源码核心思想包括以下几个角色(模块):
prospector: 找到配文件中paths下面文件, 并且启动harvesters (负责监听文件的改变)
harvester: 读取scan文件, 并提交相应的event给spooler (负责监听文件内容的改变)
spooler: 做为一个buffer缓冲池,达到大小或者计数器时间到flush池子里面的event信息给publisher (消息缓冲池)
publisher: 连接网络(connect是通过ssl方式认证),传输event数据到指定地点, 并通知registrar传输成功 (网络传输,消息传输出去)
registrar: 记录文件的records,包括日志现在读取offset等信息,默认存放在.logstash-forwarder文件下 (保存文件读取信息)
Prospector(阻塞监听) -> harvester(阻塞监听) ->spooler(阻塞监听) ->publisher(阻塞监听)->registrar(阻塞监听)的启动过程
prospector------------
主要功能函数 遍历文件属性func (p *Prospector) scan(path string, output chan *FileEvent, resume *ProspectorResume)if fileinfo.ModTime().Before(p.lastscan) && time.Since(fileinfo.ModTime()) > p.FileConfig.deadtime { var offset int64 = 0 var is_resuming bool = false if resume != nil { // Call the calculator - it will process resume state if there is one offset, is_resuming = p.calculate_resume(file, fileinfo, resume) } // Are we resuming a dead file? We have to resume even if dead so we catch any old updates to the file // This is safe as the harvester, once it hits the EOF and a timeout, will stop harvesting // Once we detect changes again we can resume another harvester again - this keeps number of go routines to a minimum if is_resuming { emit("Resuming harvester on a previously harvested file: %s\n", file) harvester := &Harvester{Path: file, FileConfig: p.FileConfig, Offset: offset, FinishChan: newinfo.harvester} go harvester.Harvest(output) } else { // Old file, skip it, but push offset of file size so we start from the end if this file changes and needs picking up emit("Skipping file (older than dead time of %v): %s\n", p.FileConfig.deadtime, file) newinfo.harvester <- fileinfo.Size() } } 主要执行到 go harvester.Harvest(output)
harvester------------
主要函数func (h *Harvester) Harvest(output chan *FileEvent),扫面文件for { text, bytesread, err := h.readline(reader, buffer, read_timeout) if err != nil { if err == io.EOF { // timed out waiting for data, got eof. // Check to see if the file was truncated info, _ := h.file.Stat() if info.Size() < h.Offset { emit("File truncated, seeking to beginning: %s\n", h.Path) h.file.Seek(0, os.SEEK_SET) h.Offset = 0 } else if age := time.Since(last_read_time); age > h.FileConfig.deadtime { // if last_read_time was more than dead time, this file is probably // dead. Stop watching it. emit("Stopping harvest of %s; last change was %v ago\n", h.Path, age) return } continue } else { emit("Unexpected state reading from %s; error: %s\n", h.Path, err) return } } last_read_time = time.Now() line++ event := &FileEvent{ Source: &h.Path, Offset: h.Offset, Line: line, Text: text, Fields: &h.FileConfig.Fields, fileinfo: &info, } h.Offset += int64(bytesread) output <- event // ship the new event downstream } /* forever */ 主要执行到 output <- event
Logstash的理念很简单,它只做3件事情:
- Collect:数据输入
- Enrich:数据加工,如过滤,改写等
- Transport:数据输出
- Shipper:日志收集者。负责监控本地日志文件的变化,及时把日志文件的最新内容收集起来,输出到Redis暂存。
- Indexer:日志存储者。负责从Redis接收日志,写入到本地文件。
- Broker:日志Hub,用来连接多个Shipper和多个Indexer。
无论是Shipper还是Indexer,Logstash始终只做前面提到的3件事:
- Shipper从日志文件读取最新的行文本,经过处理(这里我们会改写部分元数据),输出到Redis,
- Indexer从Redis读取文本,经过处理(这里我们会format文本),输出到文件。
一个Logstash进程可以有多个输入源,所以一个Logstash进程可以同时读取一台服务器上的多个日志文件。Redis是Logstash官方推荐的Broker角色“人选”,支持订阅发布和队列两种数据传输模式,推荐使用。输入输出支持过滤,改写。Logstash支持多种输出源,可以配置多个输出实现数据的多份复制,也可以输出到Email,File,Tcp,或者作为其它程序的输入,又或者安装插件实现和其他系统的对接,比如搜索引擎Elasticsearch。
Logstash的运行方式为主程序+配置文件。Collect,Enrich和Transport的行为在配置文件中定义。配置文件的格式有点像json,又有点像php。
3.3. 编写Shipper角色的配置文件:shipper.conf
1
2
3
4
5
6
7
8
9
| input { file { path => [ # 这里填写需要监控的文件 "/data/log/php/php_fetal.log", "/data/log/service1/access.log" ] }} |
如上,input描述的就是数据如何输入。这里填写你需要收集的本机日志文件路径。
1
2
3
4
5
6
7
8
9
10
11
12
13
| output { # 输出到控制台 # stdout { } # 输出到redis redis { host => "10.140.45.190" # redis主机地址 port => 6379 # redis端口号 db => 8 # redis数据库编号 data_type => "channel" # 使用发布/订阅模式 key => "logstash_list_0" # 发布通道名称 }} |
如上,output描述的就是数据如何输出。这里描述的是输出到Redis。
data_type的可选值有
channel和list两种。用过Redis的人知道,channel是Redis的发布/订阅通信模式,而list是Redis的队列数据结构。两者都可以用来实现系统间有序的消息异步通信。channel相比list的好处是,解除了发布者和订阅者之间的耦合。举个例子,一个Indexer在持续读取Redis中的记录,现在想加入第二个Indexer,如果使用list,就会出现上一条记录被第一个Indexer取走,而下一条记录被第二个Indexer取走的情况,两个Indexer之间产生了竞争,导致任何一方都没有读到完整的日志。channel就可以避免这种情况。这里Shipper角色的配置文件和下面将要提到的Indexer角色的配置文件中都使用了channel。filter { mutate { # 替换元数据host的值 replace => ["host", "10.140.46.134 B[1]"] }} |
如上,filter描述的是如何过滤数据。mutate是一个自带的过滤插件,它支持replace操作,可以改写数据。这里改写了元数据中的host字段,替换成了我们自己定义的文本。
Logstash传递的每条数据都带有元数据,如@version,@timestamp,host等等。有些可以修改,有些不允许修改。host记录的是当前主机的信息。Logstash可能不会去获取主机的信息或者获取的不准确,这里建议替换成自己定义的主机标示,以保证最终的日志输出可以有完美的格式和良好的可读性。
3.4 编写Indexer角色的配置文件:indexer.conf
1
2
3
4
5
6
7
8
9
| input { redis { host => "10.140.45.190" # redis主机地址 port => 6379 # redis端口号 db => 8 # redis数据库编号 data_type => "channel" # 使用发布/订阅模式 key => "logstash_list_0" # 发布通道名称 } } |
如上,input部分设置为从redis接收数据。
1
2
3
4
5
6
7
| output { file { path => "/data/log/logstash/all.log" # 指定写入文件路径 message_format => "%{host} %{message}" # 指定写入格式 flush_interval => 0 # 指定刷新间隔,0代表实时写入 }} |
如上,output部分设置为写入本地文件。
官方文档里flush_interval为缓冲时间(单位秒)。我实践下来不是秒而是数量,Logstash会等待缓冲区写满一定数量后才输出。这对线上调试是不能接受的,建议上线初期设为0。程序稳定后,随着日志量的增大,可以增大flush_interval的值以提高文件写入性能。
Indexer的配置文件中,我明确指定了message_format的格式,其中
%{host}对应的就是之前手动设置的host元数据。3.5. 启动Logstash
1
2
| # 先在Indexer主机上启动nohup /usr/local/logstash-1.4.3/bin/logstash agent -f indexer.conf |
我们来测试一下,切到Shipper主机上,模拟日志产生:
1
| echo "Hello World" >> /data/log/php/php_fetal.log |
再切换到Indexer主机上,如果出现:
10.140.46.134 B[1] Hello World,说明Logstash部署成功。3.6. 日志着色脚本
有些公司需要挖掘日志的价值,那仅仅收集和实时显示是不够的,需要把逼格上升到日志分析技术层面。
一个完整的日志分析技术栈需要实时收集,实时索引和展示三部分组成,Logstash只是这其中的第一个环节。Logstash所属的Elastic公司,已经开发了完整的日志分析技术栈,它们是Elasticsearch,Logstash,和Kibana,简称ELK。Elasticsearch是搜索引擎,而Kibana是Web展示界面。