https://engineering.linkedin.com/architecture/brief-history-scaling-linkedin
Leo
LinkedIn started as many sites start today, as a single monolithic application doing it all. That single app was called Leo. It hosted web servlets for all the various pages, handled business logic, and connected to a handful of LinkedIn databases.
https://engineering.linkedin.com/performance/how-linkedin-used-pops-and-rum-make-dynamic-content-download-25-faster
LinkedIn serves its dynamic content (e.g. HTML and JSON) from its data centers, while utilizing CDNs for serving the static assets such as CSS, JS, images etc. Like many other web companies, we have been using PoPs (Point of Presence) to improve the download time of the dynamic content.
PoPs are small scale data centers with mostly network equipment and proxy servers ; that act as end-points for user's TCP connection requests. PoP would establish and hold that connection while fetching the user-requested content from the data center.
In this post, we will talk about the Real User Monitoring (RUM) based data-driven approach LinkedIn took to decide optimal mapping of user requests to PoPs.
Here are a few techniques we evaluated which did not work:
Geographic distance: The simplest approach is to assume that the geographically closest PoP is the optimal PoP. Unfortunately, it is well known in the networking community that geographical proximity does not guarantee network proximity.
Network connectivity: Our Network Engineering team could have just assigned geographies to PoPs based on their understanding and knowledge of global internet connectivity. Unfortunately, the Internet is an ever changing beast (and we help change it by peering) and we would have never kept up with it by using a manual approach like this.
Synthetic measurements: We could also run synthetic tests using monitoring companies such as Keynote, Gomez, Catchpoint, and so on. These companies have a set of monitoring agents distributed across the world that can test your website. Well known problems with this approach include:
Agent geographic and network distribution may not represent our user base.
Agents usually have very good connectivity to the internet backbone, which may not be representative of our user base.
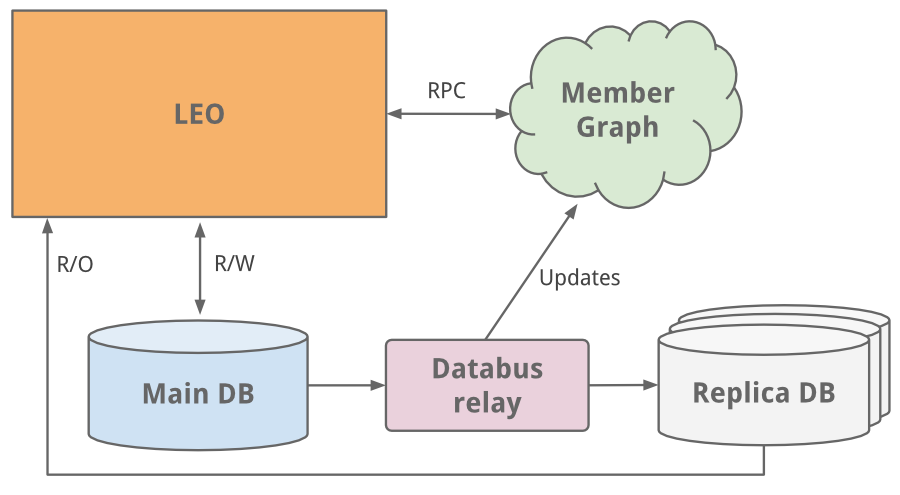
Leo
LinkedIn started as many sites start today, as a single monolithic application doing it all. That single app was called Leo. It hosted web servlets for all the various pages, handled business logic, and connected to a handful of LinkedIn databases.
Member Graph
One of the first things to do as a social network is to manage member to member connections. We needed a system that queried connection data using graph traversals and lived in-memory for top efficiency and performance. With this different usage profile, it was clear it needed to scale independently of Leo, so a separate system for our member graphcalled Cloud was born - LinkedIn’s first service. To keep this graph service separate from Leo, we used Java RPC for communication.
It was around this time we needed search capabilities. Our member graph service started feeding data into a new search service running Lucene.
Replica read DBs
As the site grew, so did Leo, increasing its role and responsibility, and naturally increasing its complexity. Load balancing helped as multiple instances of Leo were spun up. But the added load was taxing LinkedIn’s most critical system - its member profile database.
An easy fix we did was classic vertical scaling - throw more CPUs and memory at it! While that bought some time, we needed to scale further. The profile database handled both read and write traffic, and so in order to scale, replica slave DBs were introduced. The replica DBs were a copy of the member database, staying in sync using the earliest version ofdatabus (now open-sourced). They were set up to handle all read traffic and logic was built to know when it was safe (consistent) to read from a replica versus the main master DB.
* While the master-slave model worked as a medium-term solution, we’ve since moved to partitioned DBs
As the site began to see more and more traffic, our single monolithic app Leo was often going down in production, it was difficult to troubleshoot and recover, and difficult to release new code. High availability is critical to LinkedIn. It was clear we needed to “Kill Leo” and break it up into many small functional and stateless services.
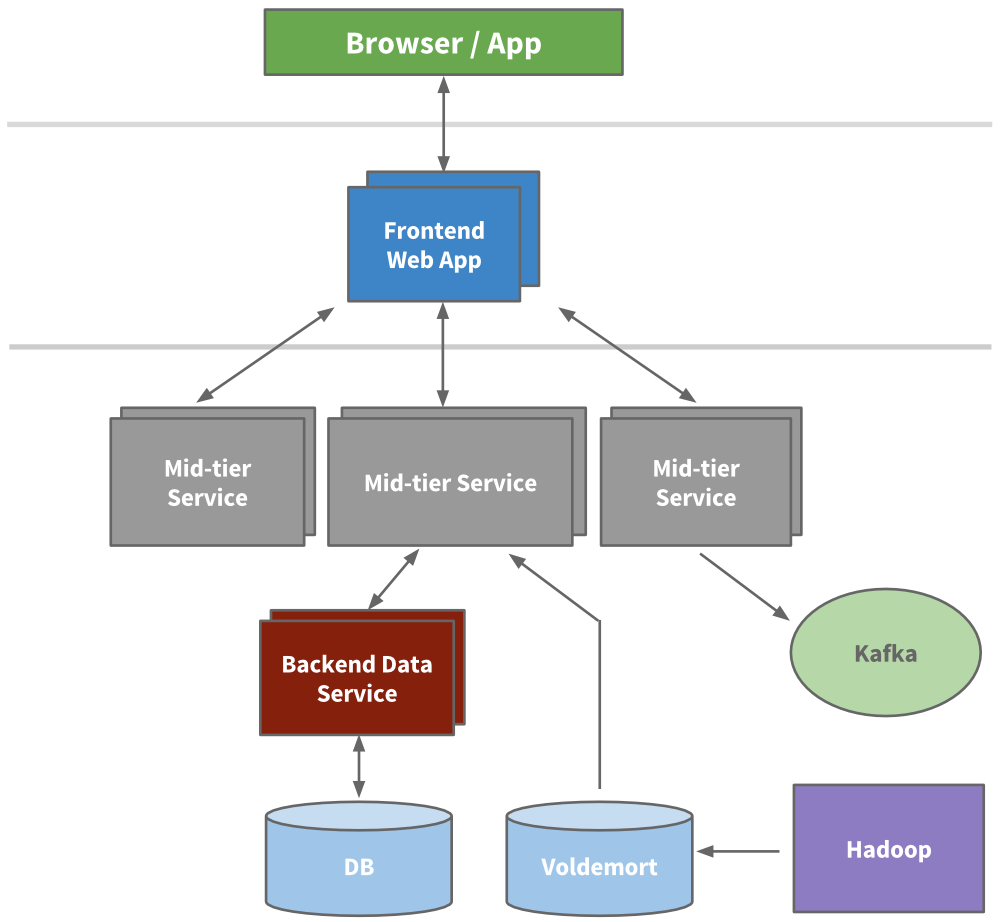
Service Oriented Architecture
Engineering started to extract micro services to hold APIs and business logic like our search, profile, communications, and groups platforms. Later, our presentation layers were extracted for areas like our recruiter product or public profile. For new products, brand new services were created outside of Leo. Over time, vertical stacks emerged for each functional area.
We built frontend servers to fetch data models from different domains, handle presentation logic, and build the HTML (via JSPs). We built mid-tier services to provide API access to data models and backend data services to provide consistent access to its database(s). By 2010, we already had over 150 separate services. Today, we have over 750 services.
Being stateless, scaling could be achieved by spinning up new instances of any of the services and using hardware load balancers between them. We actively started to redline each service to know how much load it could take, and built out early provisioning and performance monitoring capabilities.
Caching
LinkedIn was seeing hypergrowth and needed to scale further. We knew we could reduce the load altogether by adding more layers of cache. Many applications started to introduce mid-tier caching layers like memcache or couchbase. We also added caches to our data layers and started to use Voldemort with precomputed results when appropriate.
Over time, we actually removed many mid-tier caches. Mid-tier caches were storing derived data from multiple domains. While caches appear to be a simple way to reduce load at first, the complexity around invalidation and the call graph was getting out of hand. Keeping the cache closest to the data store as possible keeps latencies low, allows us to scale horizontally, and reduces the cognitive load.
Kafka
The result was the development of Kafka, our distributed pub-sub messaging platform. Kafka became a universal pipeline, built around the concept of a commit log, and was built with speed and scalability in mind. It enabled near realtime access to any data source, empowered our Hadoop jobs, allowed us to build realtime analytics, vastly improved our site monitoring andalerting capability, and enabled us to visualize and track our call graphs. Today, Kafka handles well over 500 billion events per day.
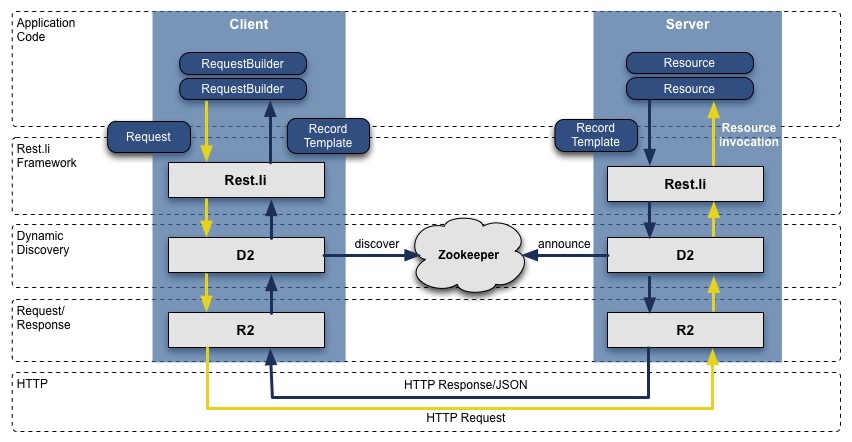
Rest.li
When we transformed from Leo to a service oriented architecture, the APIs we extracted assumed Java-based RPC, were inconsistent across teams, were tightly coupled with the presentation layer, and it was only getting worse. To address this, we built out a new API model called Rest.li. Rest.li was our move towards a data model centric architecture, which ensured a consistent stateless Restful API model across the company.
By using JSON over HTTP, our new APIs finally made it easy to have non-Java-based clients. LinkedIn today is still mainly a Java shop, but also has many clients utilizing Python, Ruby, Node.js, and C++ both developed in house as well as from tech stacks of our acquisitions. Moving away from RPC also freed us from high coupling with presentation tiers and many backwards compatibility problems. Plus, by using Dynamic Discovery (D2)with Rest.li, we got automated client based load balancing, discovery, and scalability of each service API.
Today, LinkedIn has over 975 Rest.li resources and over 100 billion Rest.li calls per day across all our datacenters.Super Blocks
Service oriented architectures work well to decouple domains and scale services independently. But there are downsides. Many of our applications fetch many types of different data, in turn making hundreds of downstream calls. This is typically referred to as a “call graph”, or “fanout” when considering all the many downstream calls. For example, any Profile page request fetches much more beyond just profile data including photos, connections, groups, subscription info, following info, long form blog posts, connection degrees from our graph, recommendations, etc. This call graph can be difficult to manage and was only getting more and more unruly.
We introduced the concept of a super block - groupings of backend services with a single access API. This allows us to have a specific team optimize the block, while keeping our call graph in check for each client.
Multi-Data Center
Many of our databases run on Espresso (a new in-house multi-tenant datastore). Espresso was built with multi data centers in mind. It provides master / master support and handles much of the difficult replication.
Multiple data centers are incredibly important to maintain “site-up” and high availability. You need to avoid any single point of failure not just for each individual service, but the entire site. Today, LinkedIn runs out of three main data centers, with additional PoPs around the globe.
Many of our most critical systems have their own rich history and evolution to address scale over the years. This includes our member graph service (our first service outside from Leo), search (our second service), news feed, communications platform, and member profile backend.
We’ve built data infrastructure that enables long term growth. This was first evident with Databus and Kafka, and has continued with Samza for data streams, Espresso and Voldemort for storage solutions, Pinot for our analytics systems, as well as other custom solutions. Plus, our tooling has improved such that developers can provision this infra automatically.
We’ve developed a massive offline workflow using Hadoop and our Voldemort data store to precompute data insights like People You May Know, Similar profiles, Notable Alumni, and profile browse maps.
We’ve rethought our frontend approach, adding client templates into the mix (Profile page,University pages). This enables more interactive applications, requiring our servers to send only JSON or partial JSON. Plus, templates get cached in CDNs and the browser. We also started to use BigPipe and the Play framework, changing our model from a threaded web server to a non-blocking asynchronous one.
Beyond the application code, we’ve introduced multiple tiers of proxies using Apache Traffic Server and HAProxy to handle load balancing, data center pinning, security, intelligent routing, server side rendering, and more.
And finally, we continue to improve the performance of our servers with optimized hardware, advanced memory and system tuning, and utilizing newer Java runtimes.
http://colobu.com/2015/07/24/brief-history-scaling-linkedin/https://engineering.linkedin.com/performance/how-linkedin-used-pops-and-rum-make-dynamic-content-download-25-faster
LinkedIn serves its dynamic content (e.g. HTML and JSON) from its data centers, while utilizing CDNs for serving the static assets such as CSS, JS, images etc. Like many other web companies, we have been using PoPs (Point of Presence) to improve the download time of the dynamic content.
PoPs are small scale data centers with mostly network equipment and proxy servers ; that act as end-points for user's TCP connection requests. PoP would establish and hold that connection while fetching the user-requested content from the data center.
In this post, we will talk about the Real User Monitoring (RUM) based data-driven approach LinkedIn took to decide optimal mapping of user requests to PoPs.
Let's take an example of the LinkedIn desktop homepage and go over how PoPs help to improve the measured page performance.

Here are the sequence of steps for downloading the desktop homepage
Finding optimal PoP per geographyHere are the sequence of steps for downloading the desktop homepage
- DNS: User’s browser initiates a DNS resolution of www.linkedin.com and gets the IP address of the PoP.
- Connection: User’s browser then connects to the PoP (TCP + SSL handshake). This time duration is called connect time.
- HTTP request to PoP: The browser then sends a HTTP GET request for the page to the PoP (usually with TCP's SYN-ACK packet).
- HTTP request to DC: PoP makes the same request to the data center (DC). But because PoP and data centers are owned by LinkedIn and are constantly communicating with each other, an existing TCP connection between them is used to request the page.
- Early flush: Data center does an "early flush" of content that is available, without waiting for the entire page to be assembled (usually the <HEAD> of the HTML) to the PoP, which the PoP then sends to the browser.
- HTTP response from DC: Servers at the data center build the rest of the page and send it to the PoP as it is assembled. Since the page is sent on an existing TCP connection, this TCP connection will likely have large TCP congestion windows. Thus the whole page could be potentially sent in one round trip time (RTT).
- HTTP response from PoP: As PoP receives the page, it relays the page packet by packet to the browser. Since the PoP to browser connection is usually not a long-lived connection, the congestion windows at this point are much smaller. TCP’s slow start algorithm kicks in and multiple RTTs are needed to finish serving the page to the browser.
Here are a few techniques we evaluated which did not work:
Geographic distance: The simplest approach is to assume that the geographically closest PoP is the optimal PoP. Unfortunately, it is well known in the networking community that geographical proximity does not guarantee network proximity.
Network connectivity: Our Network Engineering team could have just assigned geographies to PoPs based on their understanding and knowledge of global internet connectivity. Unfortunately, the Internet is an ever changing beast (and we help change it by peering) and we would have never kept up with it by using a manual approach like this.
Synthetic measurements: We could also run synthetic tests using monitoring companies such as Keynote, Gomez, Catchpoint, and so on. These companies have a set of monitoring agents distributed across the world that can test your website. Well known problems with this approach include:
Agent geographic and network distribution may not represent our user base.
Agents usually have very good connectivity to the internet backbone, which may not be representative of our user base.